
Learn how cooling towers work, what range and approach mean, how to estimate evaporation and blowdown, and why Legionella control is essential.
The water cools, but the heat must go somewhere
If evaporating a small fraction of water can cool the remainder, why are cooling towers so important to factories, buildings and power plants? They provide a route for rejecting heat to the atmosphere. The served process keeps producing thermal energy, which must travel through equipment and piping before crossing a final boundary with the environment.
In central HVAC, a tower may receive heat from a chiller condenser. An industrial plant may connect a process circuit through heat exchangers. At a data center, a tower can form part of the infrastructure receiving heat from cooling loops. These applications share principles without necessarily sharing water quality, temperatures, configuration or sanitary management requirements.
A tower does not create cold: it combines heat and mass transfer, relying mainly on evaporation. We will follow that physics through water consumption, electricity and maintenance. A hypothetical 500 kW example organizes the calculations; its outputs are neither equipment selection nor a performance prediction for a real installation or permission to operate without technical assessment.
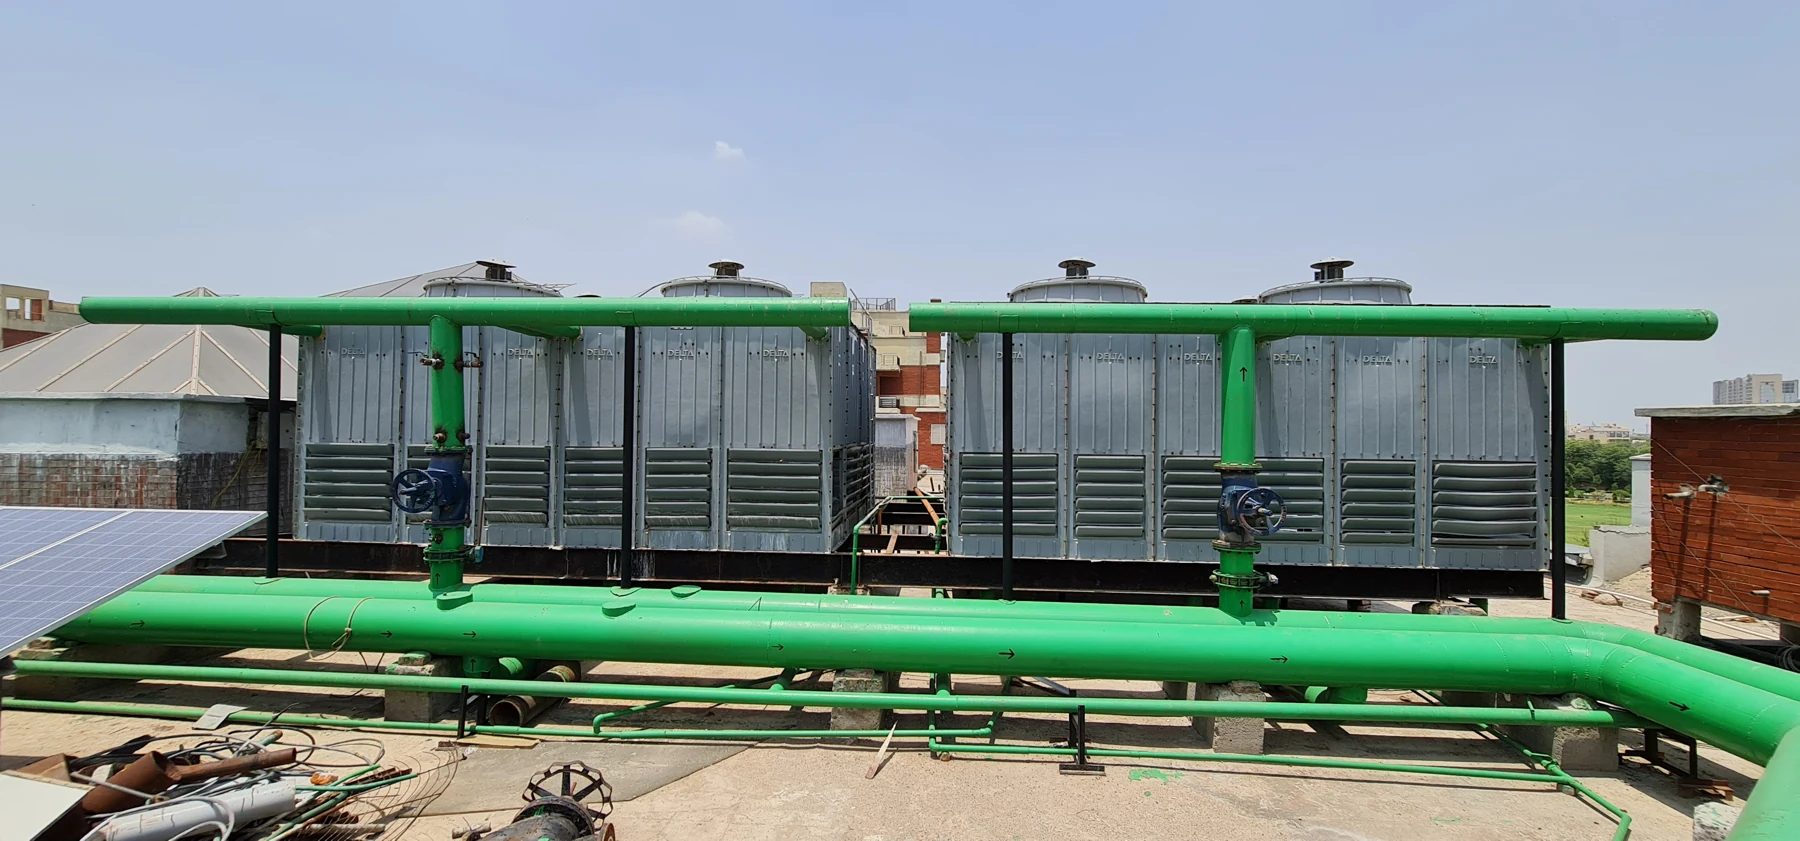
Latent heat: a little mass can carry substantial energy
Water needs energy to evaporate. When this phase change occurs inside a tower, some energy comes from the liquid stream itself, allowing its temperature to decrease. Latent heat of vaporization expresses the required energy per unit of evaporated mass. It depends on conditions; our explicitly stated teaching approximation is 2,400 kJ/kg.
The air contacting the water also exchanges sensible heat and gains moisture. A fuller balance follows moist-air enthalpy, flow rates, and inlet and outlet states. Dividing the entire heat duty by latent heat therefore represents a latent-only rejection model. It does not establish that every operating tower evaporates exactly that amount of water.
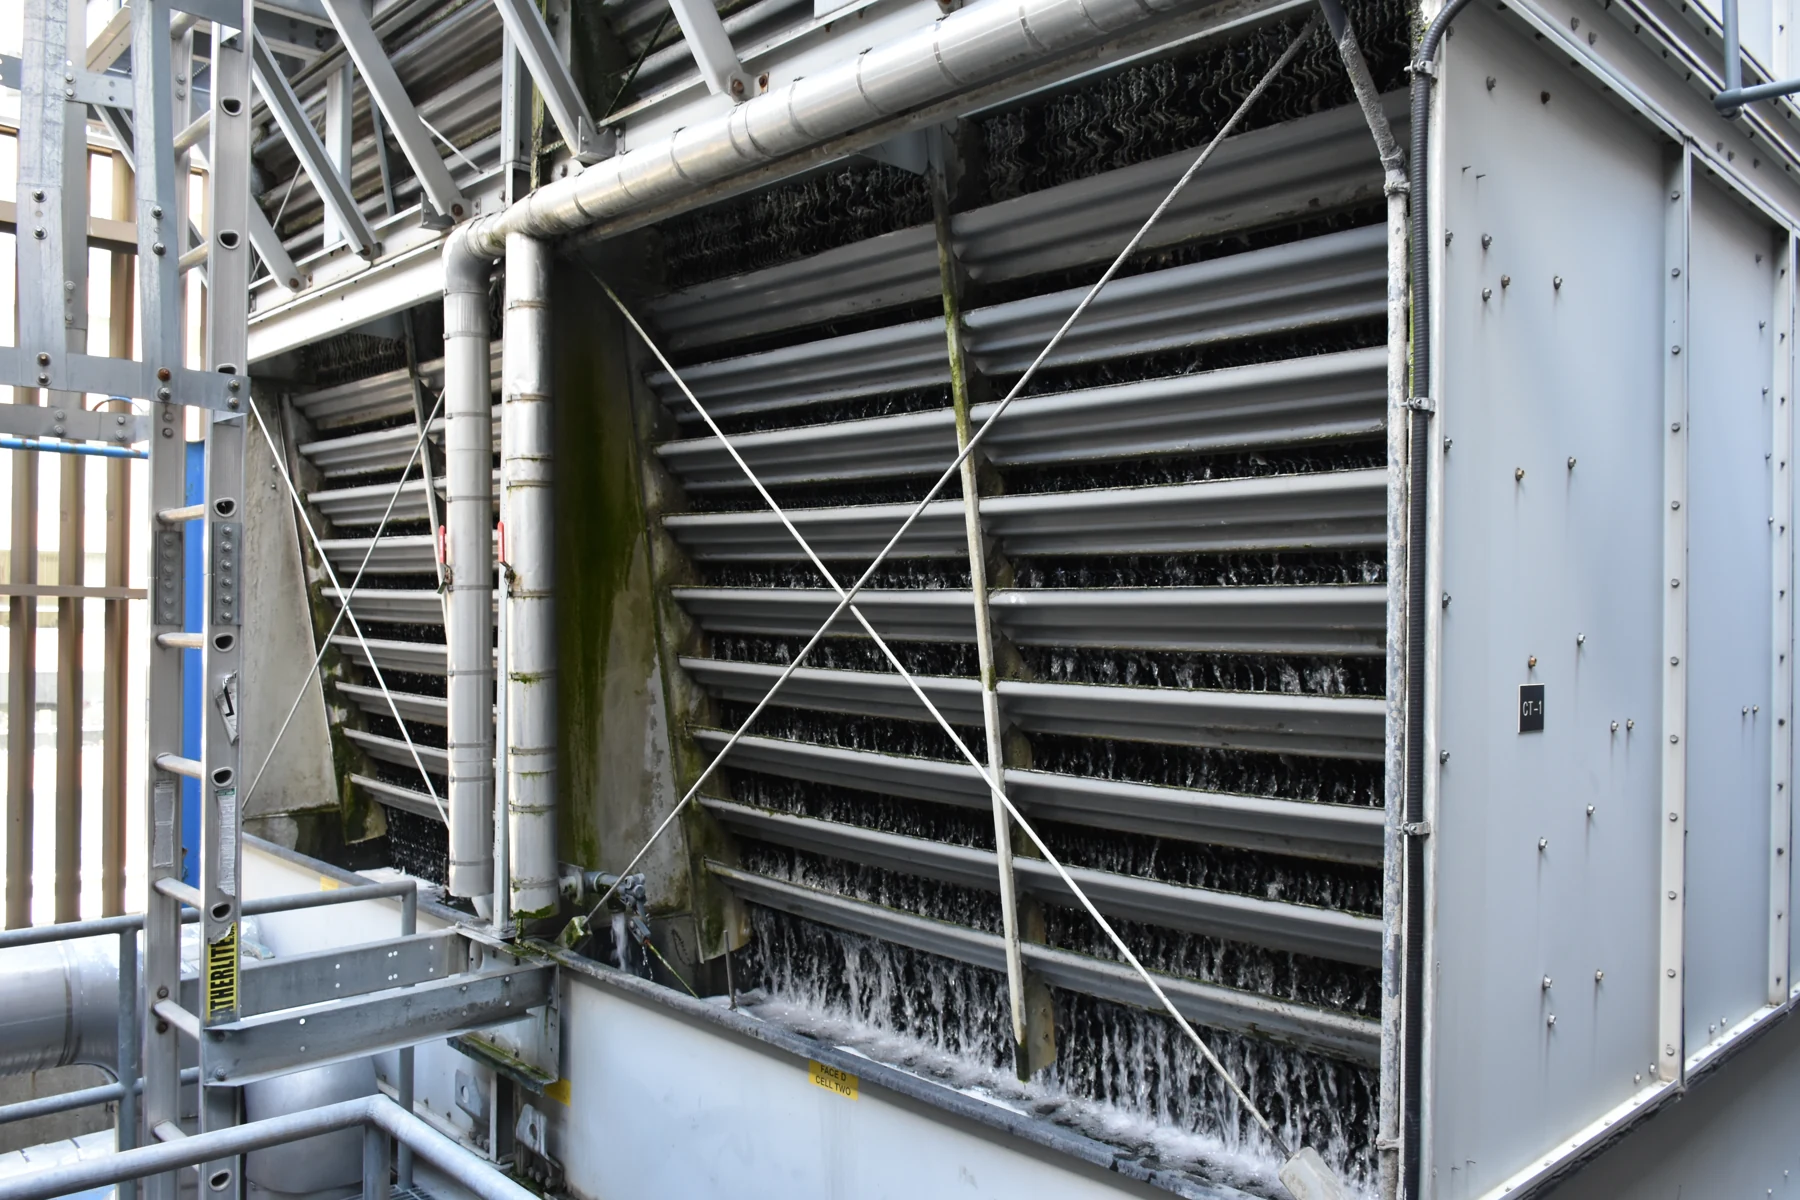
Fill increases the contact surface and contact time between air and water. Distributors, fans, air inlets and the basin help organize both streams. Deposits, uneven distribution or recirculation of discharge air can impair heat exchange while the pump keeps moving water. Thermal behavior depends on the complete arrangement, rather than the mere presence of a fan.
SPX Cooling Technologies — Basic Theory and Practice(CTII-01A) →
NISTIR5078 — Thermodynamic Properties of Water, IAPWS-95 Tables →
Wet bulb, range and approach: three different references
Wet-bulb temperature is a crucial psychrometric reference for evaporative cooling. It depends on the air state and should represent air actually entering the tower. The dry-bulb temperature familiar from weather forecasts cannot replace it. Measuring air away from the installation can also conceal local recirculation of warm, humid discharge air.
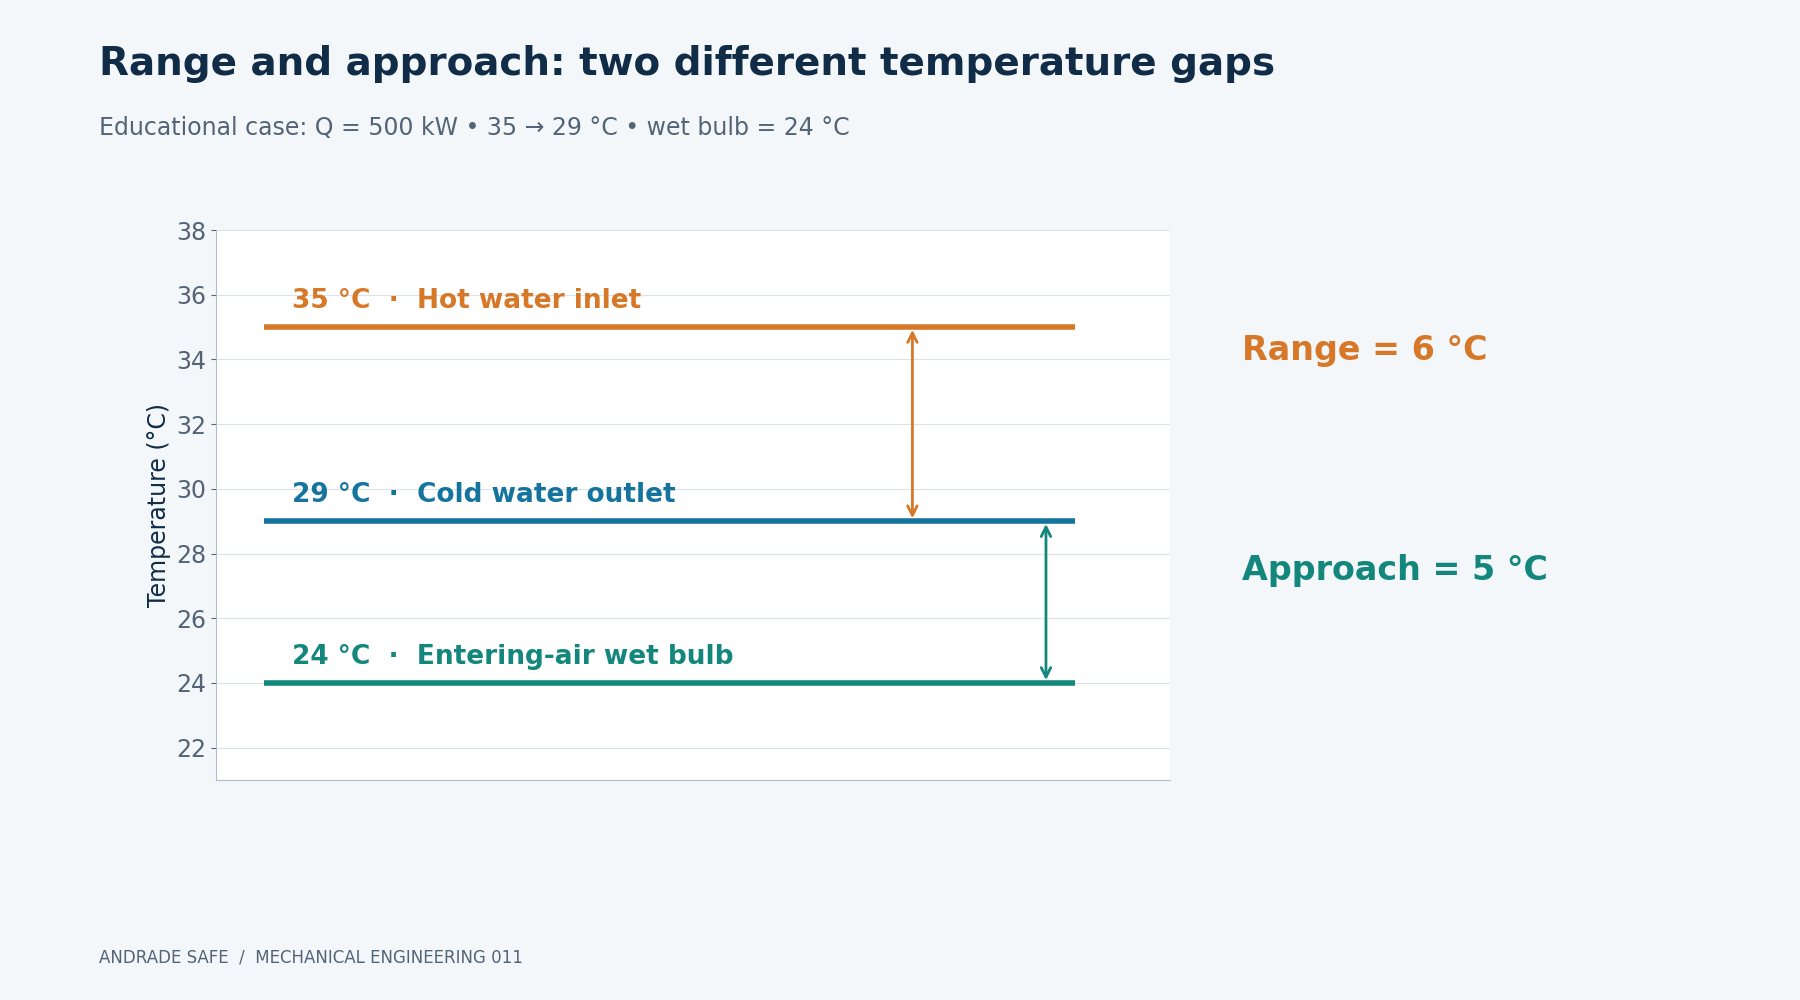
Range is the difference between entering hot-water and leaving cold-water temperatures. Approach is the difference between leaving cold-water temperature and entering-air wet-bulb temperature. Both are temperature differences, expressed in kelvin or numerically in degrees Celsius. In the 35/29/24 °C example, the range is 6 °C and the approach is 5 °C.
A smaller approach requires a more demanding thermal convergence, normally calling for greater transfer capability, a larger tower or more airflow under comparable conditions. It is not an efficiency certificate by itself. A finite conventional evaporative tower should not be promised a zero or negative approach; range, meanwhile, follows from heat duty and water flow.
SPX Cooling Technologies — Cooling Tower Performance: Approach(TR-016) →
| Quantity | Definition | Teaching example |
|---|---|---|
| Wet bulb | Entering-air reference | 24 °C |
| Range | Hot water − cold water | 35 − 29 = 6 °C |
| Approach | Cold water − wet bulb | 29 − 24 = 5 °C |
Open circuits, closed circuits and draft arrangements
In an open-circuit tower, circulating water contacts the air directly. This promotes heat and mass transfer but exposes the loop to impurities and increasing salt concentration. Compatibility with connected equipment depends on water quality, treatment, materials and whether the process can be separated from tower water by an intermediate heat exchanger.
In an evaporative closed-circuit tower, process fluid travels inside a coil or another closed element; spray water and air cool its external surface. The process remains separate from the spray-water circuit. However, the external water can still generate aerosols and requires Legionella control. A closed process circuit does not automatically eliminate sanitary risk.
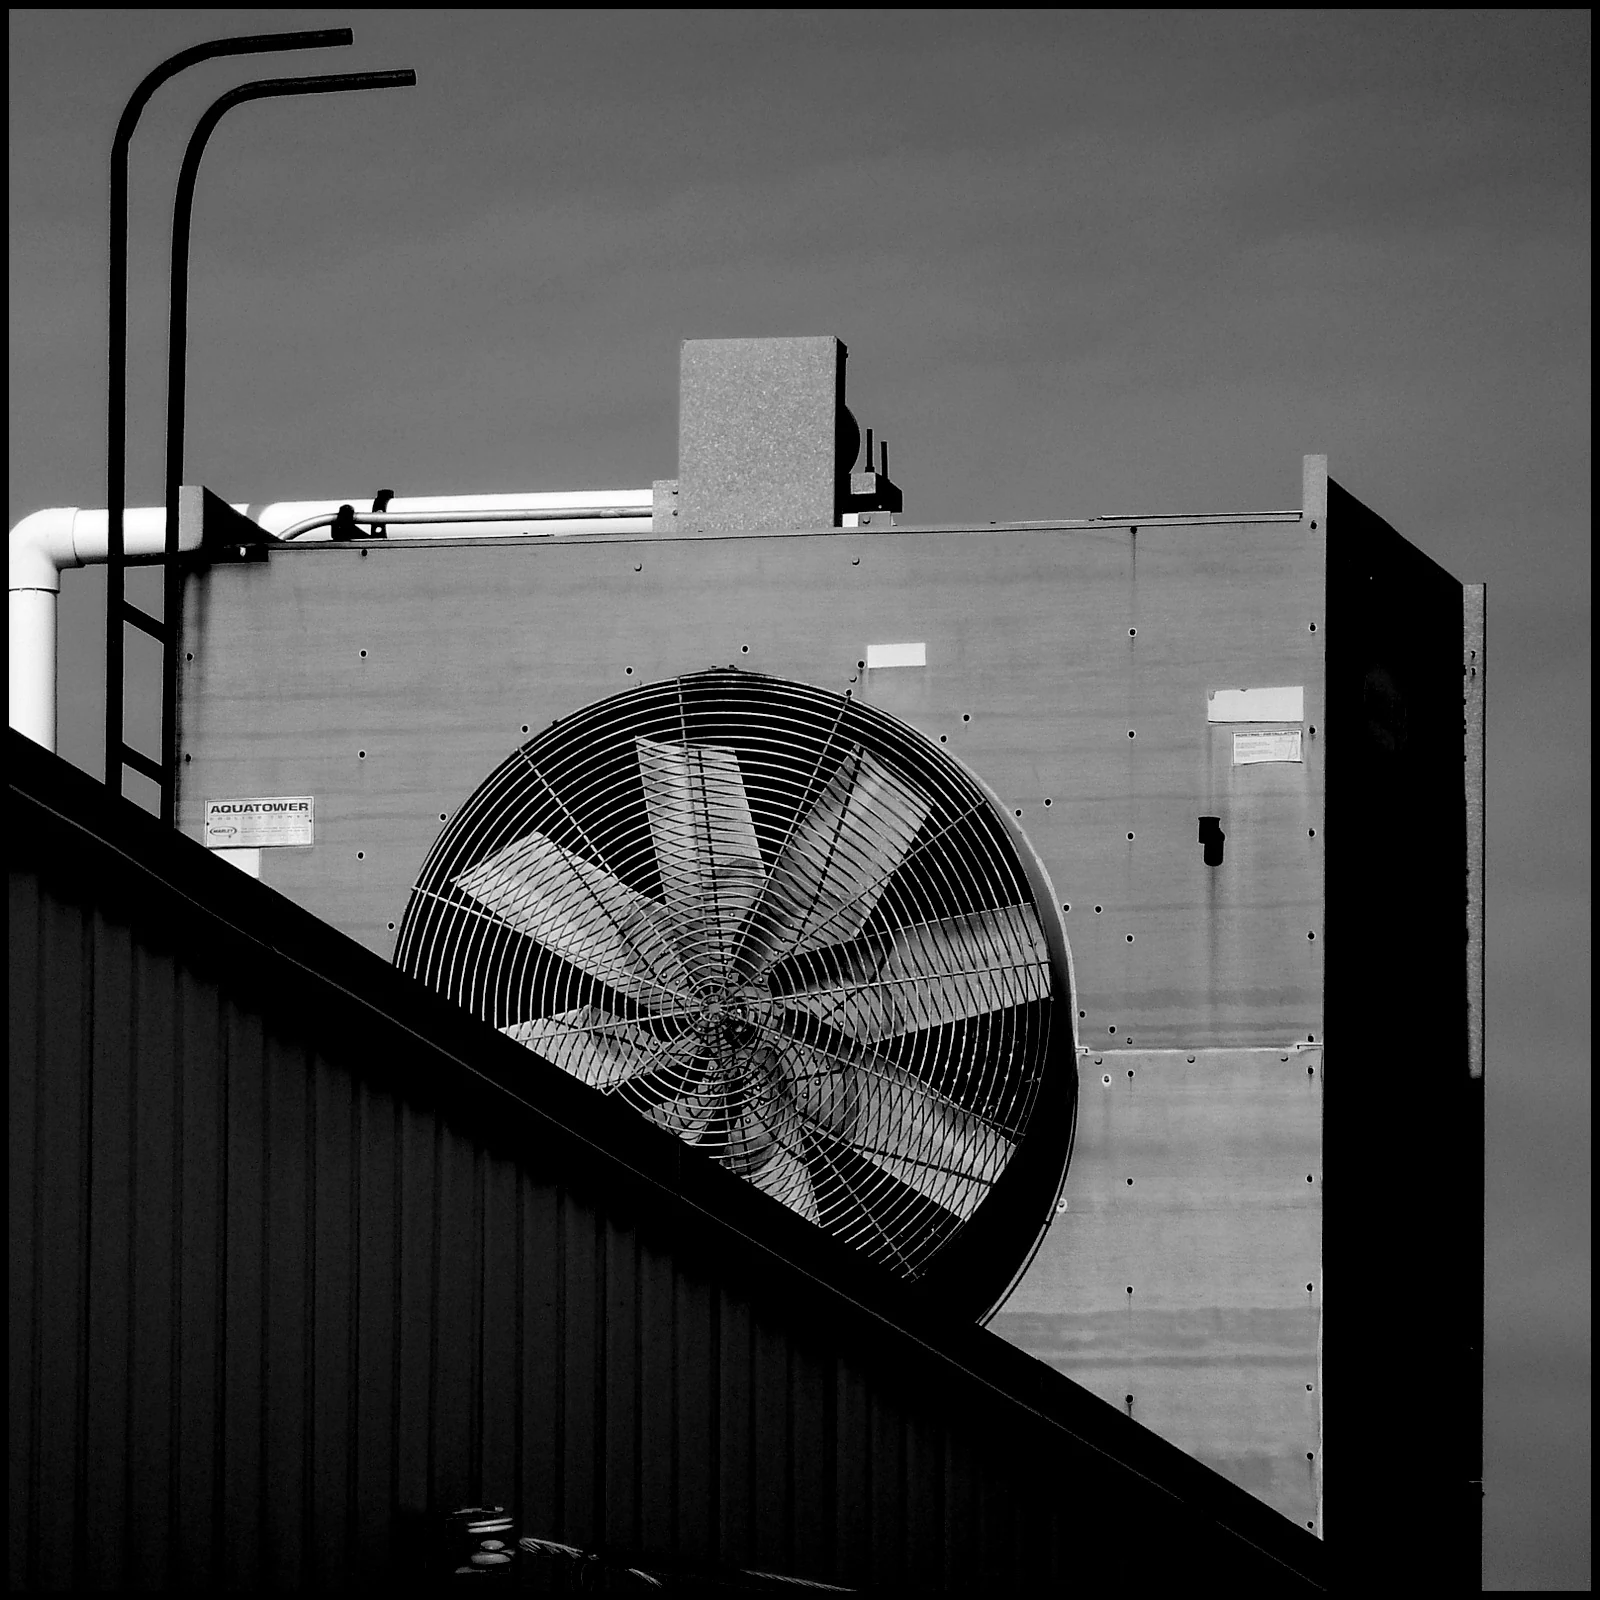
Natural draft relies on density differences to promote airflow. Mechanical-draft towers use fans: induced draft pulls air through the tower, while forced draft pushes it from the inlet. Crossflow and counterflow describe the relative directions of air and water. These classifications combine and affect access, distribution, noise, layout and maintenance requirements.
Baltimore Aircoil — What is a Cooling Tower? →
Baltimore Aircoil — What is a Closed Circuit Cooling Tower? →
Worked exercise 1: what flow carries 500 kW?
Assume steady operation, water specific heat cp = 4.186 kJ/(kg·K), approximate density of 1,000 kg/m³, and small variations in these properties. Rejected heat duty is Q = 500 kW, with water entering at 35 °C and leaving at 29 °C. Since 1 kW equals 1 kJ/s, the units give mass flow directly.
Using Q = ṁ × cp × ΔT gives ṁ = 500 / (4.186 × 6) = 19.9076 kg/s. Converting to volumetric flow: V̇ = ṁ / ρ × 3,600 = 71.6675 m³/h, approximately 71.7 m³/h. This is circulating water carrying heat; it is not the quantity consumed or evaporated every hour.
With an entering wet bulb of 24 °C, the desired 29 °C outlet sets a 5 °C approach. These calculations organize thermal duty without proving that a particular tower can deliver it. That requires capacity at design conditions, manufacturer performance data, hydraulic distribution, actual entering-air conditions and margins suitable for the application.
| Step | Calculation | Result |
|---|---|---|
| Thermal duty | Q | 500 kW |
| Mass flow | 500 / (4.186 × 6) | 19.9076 kg/s |
| Circulating flow | 19.9076 × 3,600 / 1,000 | 71.6675 m³/h |
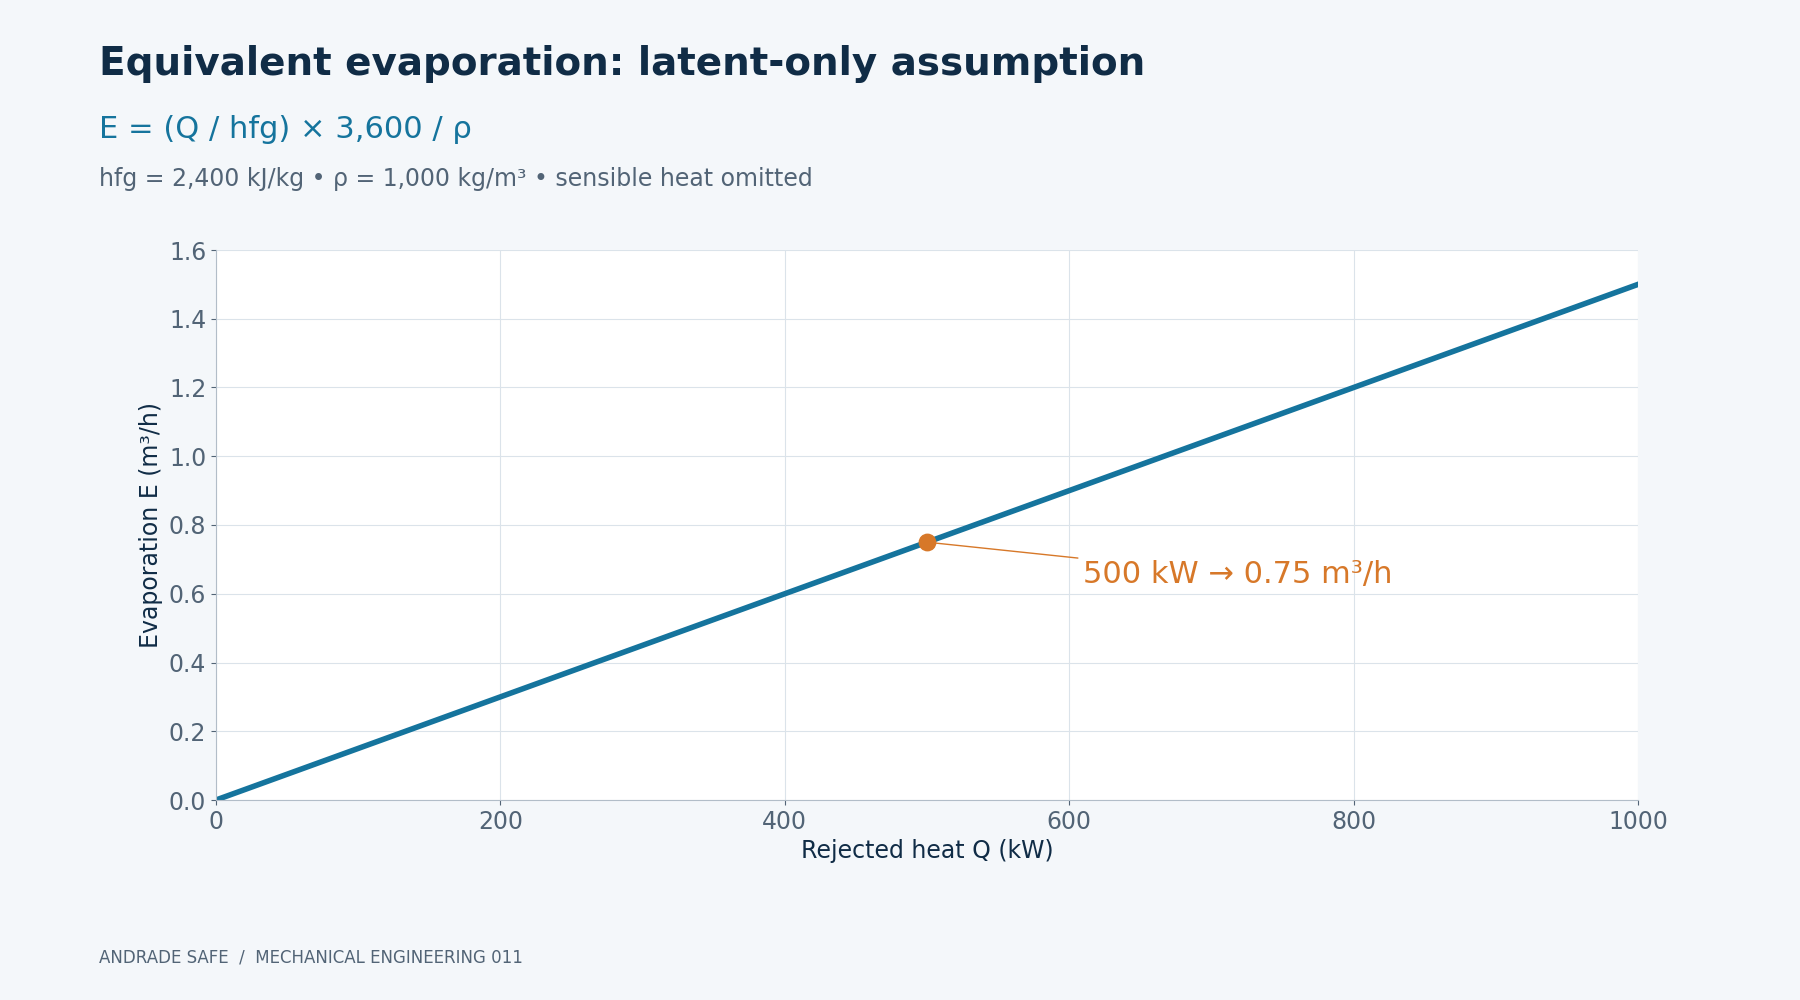
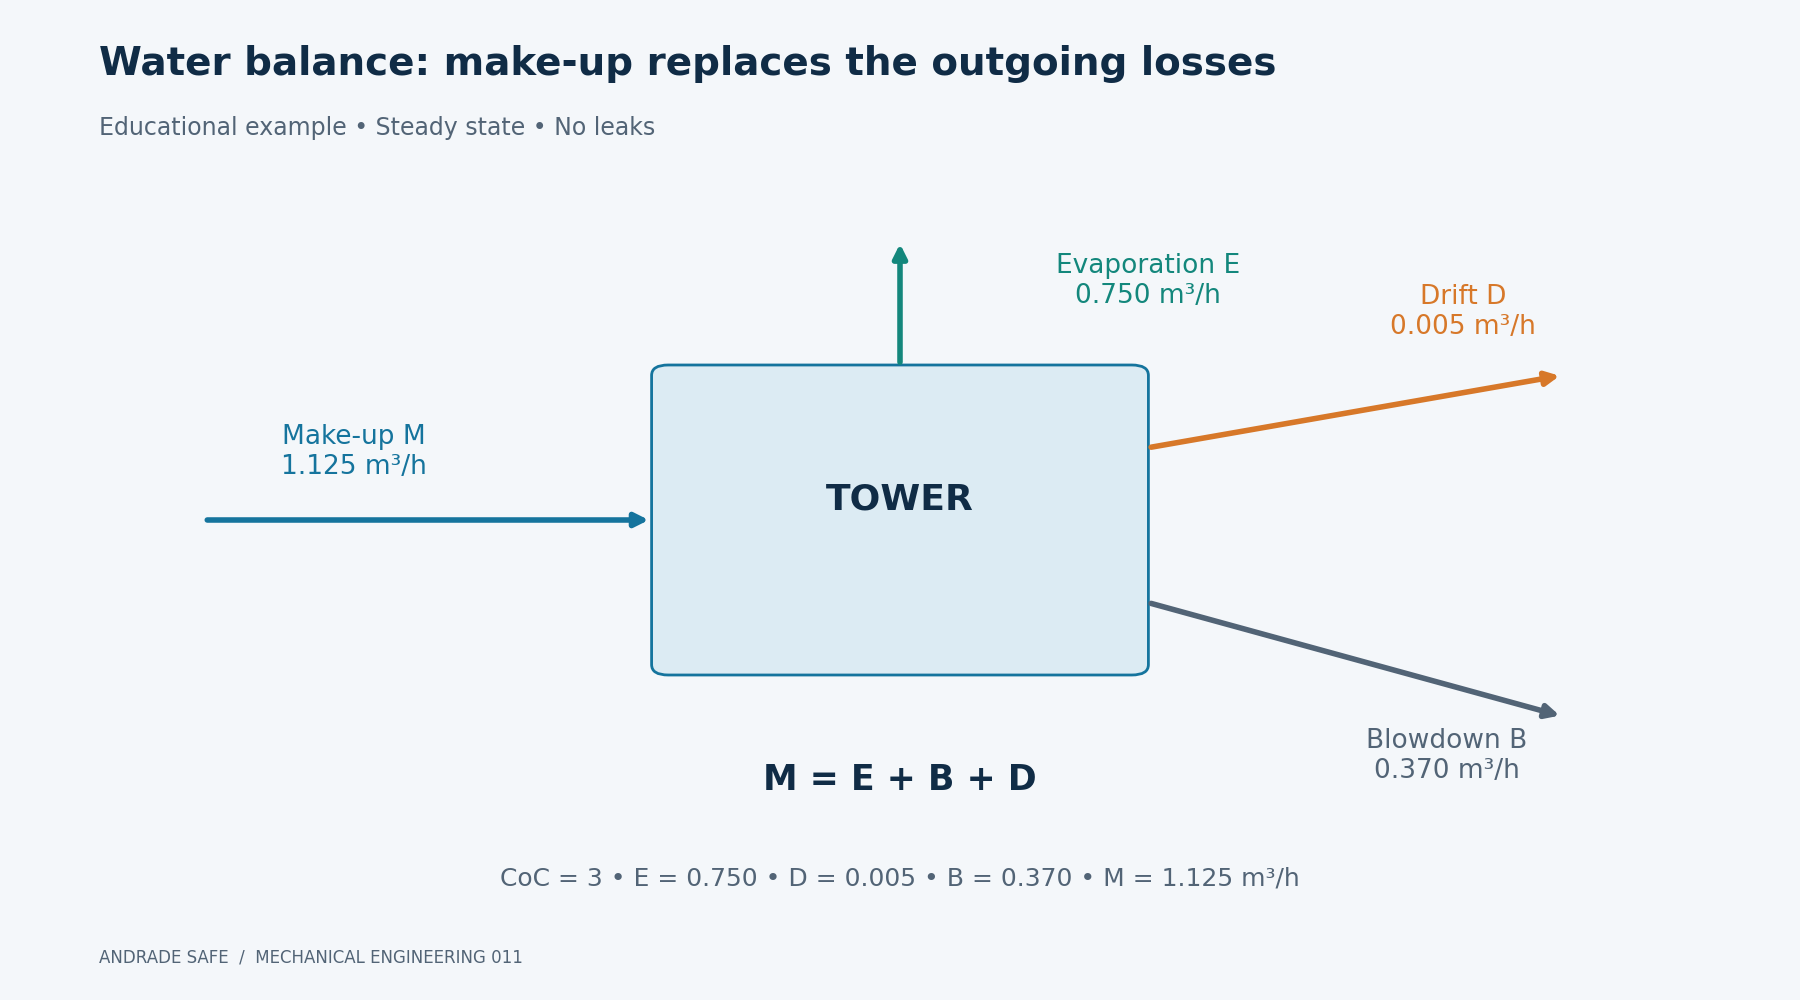
| Latent-only evaporation | 500 / 2,400 × 3,600 / 1,000 | 0.75 m³/h |
Worked exercise 2: estimate evaporation and state the assumption
Now assume, solely for this exercise, that all 500 kW are rejected as latent heat. Estimated evaporation is ṁevap = Q / hfg = 500 / 2,400 = 0.20833 kg/s. The calculation divides energy per second by energy per kilogram, giving the mass evaporated per second. It is a deliberately simplified energy model.
The correct conversion is E = 0.20833 × 3,600 / 1,000 = 0.75 m³/h. Multiplication by 3,600 converts seconds to hours, and division by density converts kilograms to cubic meters. Dividing by one thousand again would incorrectly shrink the result. The circulating flow of 71.7 m³/h and evaporation of 0.75 m³/h describe different quantities.
In actual operation, the division between sensible and latent transfer depends on air conditions, flow rates and tower behavior. The calculated value is a latent-only model estimate, not a guaranteed consumption, measurement or universal bound. Design and consumption reconciliation need an appropriate psychrometric balance and operating data, together with the other water losses.
Evaporation, drift, blowdown and make-up are different flows
Evaporation converts liquid water to vapor and leaves most nonvolatile salts in the remaining liquid. Drift is the escape of liquid droplets in the airflow; droplets may carry salts and microorganisms. Drift eliminators reduce this carryover but require correct installation, sound condition and maintenance. They do not turn a water-management program into an optional extra.
Blowdown intentionally removes concentrated water to control accumulated constituents. Make-up replaces the outgoing water. For a simplified steady state without leaks or other losses, M = E + B + D: make-up equals evaporation, blowdown and drift. Additional outlets must be included whenever they exist; otherwise, the apparent balance hides rather than explains consumption.
A make-up meter records incoming water, while blowdown metering helps identify its destination. Comparing purchased water only with estimated evaporation can conceal leaks, overflow or excessive discharge. Recording matching periods, operating states and instrument resolution makes high consumption a testable engineering question rather than an impression or a premature diagnosis of tower performance.
DOE FEMP — Best Management Practice #10: Cooling Tower Management →
Cycles of concentration: the salt balance explains blowdown
Cycles of concentration, CoC, express the concentration ratio of a conservative constituent in circulating water and make-up water. Conductivity can be an operating indicator where its interpretation fits the water chemistry. A convenient reading is not a complete characterization of salts, treatment effectiveness or microbiological condition. Water-management decisions require more than a single number.
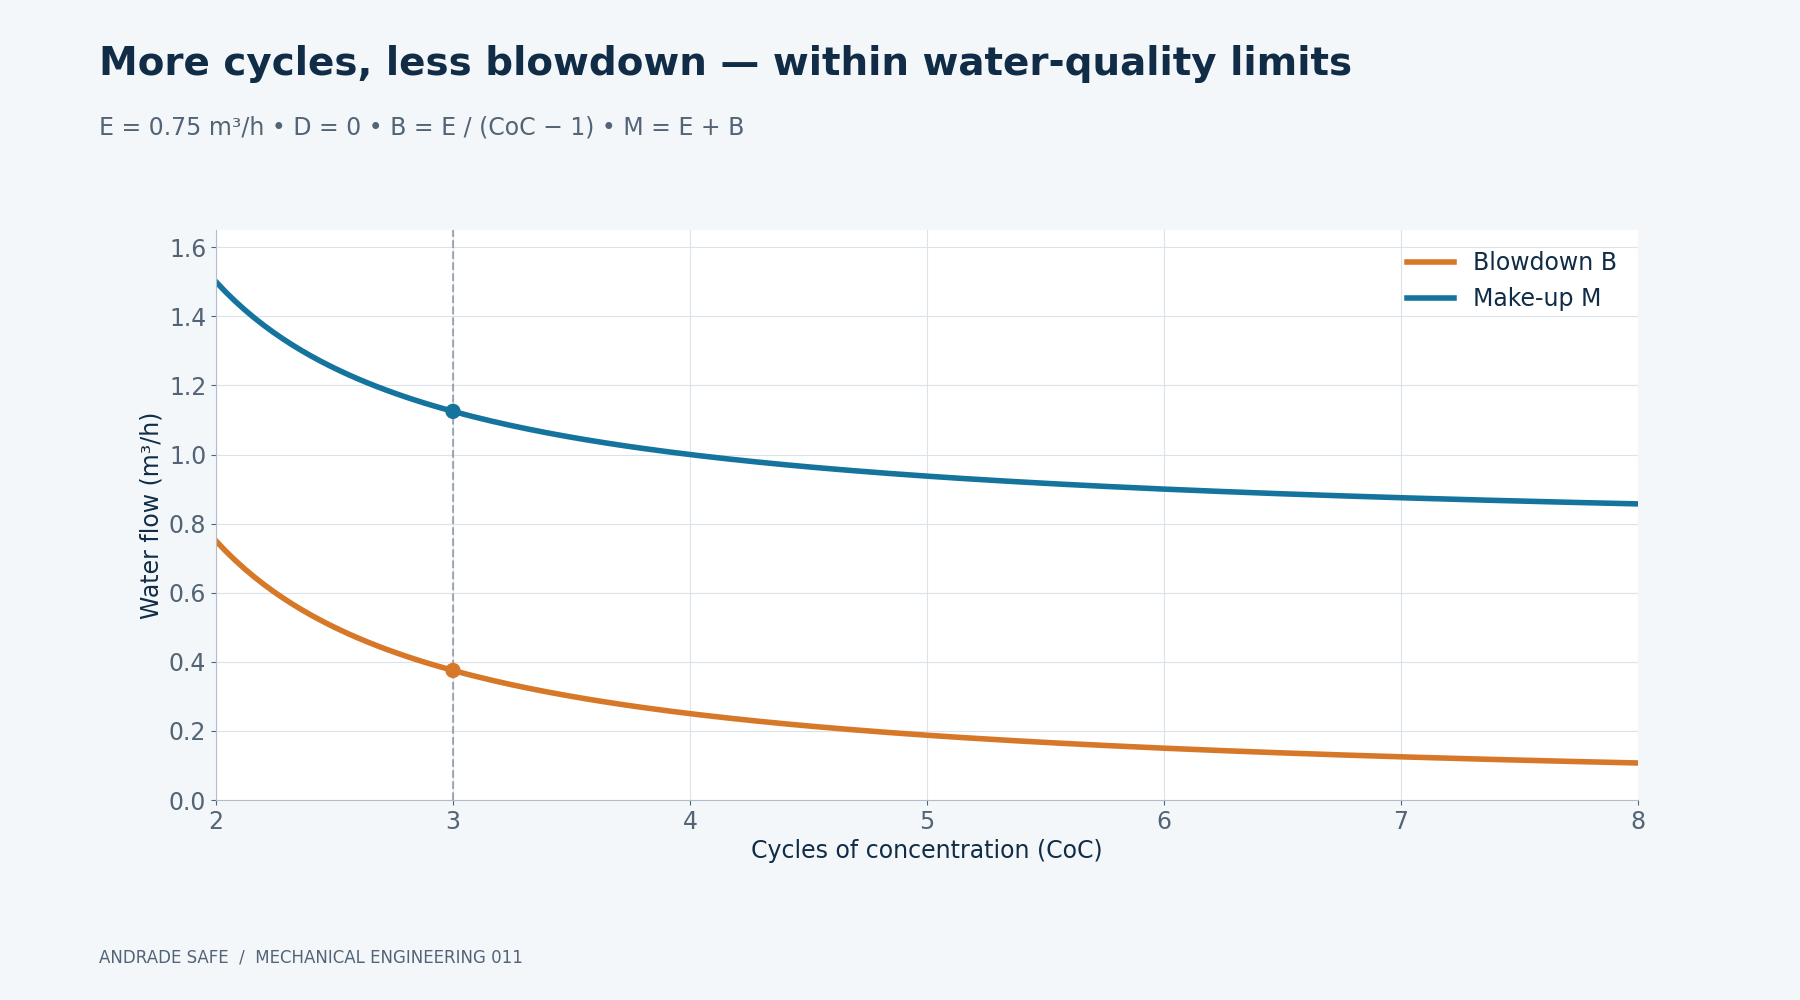
For steady state, uniform concentration, drift carrying basin concentration and evaporation free of nonvolatile salts, the solute balance is M × Cmake-up = (B + D) × Ccirculating. Taking CoC = Ccirculating / Cmake-up and M = E + B + D gives B = E / (CoC − 1) − D. The constituent used in this balance must not precipitate or receive a relevant chemical addition.
The approximation B ≈ E / (CoC − 1) is consistent only when drift is negligible. Using it and then adding significant drift to make-up breaks exact correspondence with the chosen CoC. If the expression produces negative blowdown, the requested conditions and assumptions are incompatible: a valve cannot provide negative water discharge.
EPA WaterSense at Work — Section6.3 Cooling Towers →
DOE — Cooling Towers: Understanding Key Components and How to Improve Water Efficiency →
Worked exercise 3: how much do cycles change make-up?
Keep E = 0.75 m³/h and initially neglect drift. At CoC = 2, blowdown is 0.75 / (2 − 1) = 0.75 m³/h and make-up is 1.50 m³/h. At CoC = 6, blowdown falls to 0.15 m³/h and make-up to 0.90 m³/h. Evaporation remains unchanged within this model.
The table shows diminishing returns: moving from two to six cycles substantially reduces blowdown, but moving from six to ten saves less water in absolute terms. There is no universal optimum. Alkalinity, hardness, silica, chlorides, materials, temperature, discharge restrictions and treatment strategy may all constrain how far concentration can reasonably be increased.
Include drift of 0.002% of circulation: D = 71.6675 × 0.00002 = 0.001433 m³/h. At six cycles, B = 0.75 / 5 − 0.001433 = 0.148567 m³/h; M = 0.75 + 0.148567 + 0.001433 = 0.90 m³/h. Under these assumptions, drift replaces part of blowdown as a salt outlet; it is not a desirable water-saving strategy.
| CoC | Evaporation E (m³/h) | Blowdown B (m³/h) | Make-up M (m³/h) |
|---|---|---|---|
| 2 | 0.7500 | 0.7500 | 1.5000 |
| 3 | 0.7500 | 0.3750 | 1.1250 |
| 6 | 0.7500 | 0.1500 | 0.9000 |
| 10 | 0.7500 | 0.0833 | 0.8333 |
Auxiliary electricity: optimize the entire installation
Evaporation offers a favorable thermal route, but operating a tower is not energetically free. Fans move air, pumps overcome pressure differences and transport water, and treatment and control systems also use resources. Lower leaving-water temperature may help the connected equipment while simultaneously requiring more fan effort. The useful trade-off belongs to the complete system.
Under ideal similarity and an approximately fixed system, affinity laws relate airflow to rotational speed and power to its cube. This helps explain variable-speed drives but does not guarantee cubic savings in every situation. Motor and drive efficiency, system curves, operating limits and changes in operating regime can alter the actual relationship between speed and electricity use.
Evaluate the combined consumption of tower, pumps, chiller or process. Slowing a fan may save tower electricity while increasing compressor work if the water becomes warmer. Measurements of heat duty, temperatures and power across different weather conditions help establish control settings and priorities consistent with the required service rather than a single equipment-level performance target.
DOE FEMP — Best Management Practice #10: Cooling Tower Management →
Scale, corrosion, sediment and biofilm
Salt concentration can encourage deposits when chemistry and temperature cause precipitation. Scale adds resistance to heat transfer and may interfere with water distribution. Increasing CoC without examining available water can therefore exchange an apparent make-up saving for impaired thermal performance, frequent cleaning and downtime. The water balance and the materials must be considered together.
Corrosion threatens materials, piping and heat-transfer surfaces. Accumulated sediment and biofilm create unfavorable conditions for cleaning and microbiological control. A single chemical parameter inside its expected range does not establish that every surface is clean, intact or protected. Diagnosis depends on inspection, trends and assessment by the team responsible for treatment and operation.
A consistent routine combines checks on distribution, basin, fill, eliminators, filters and poorly circulated areas with water and maintenance records. Products, dosing and compatibility must be established for the installation by responsible professionals. This example prescribes no biocide, inhibitor or chemical concentration: the same recipe can be unsuitable when water chemistry or construction materials change.
Legionella: manage water conditions and aerosol dispersion
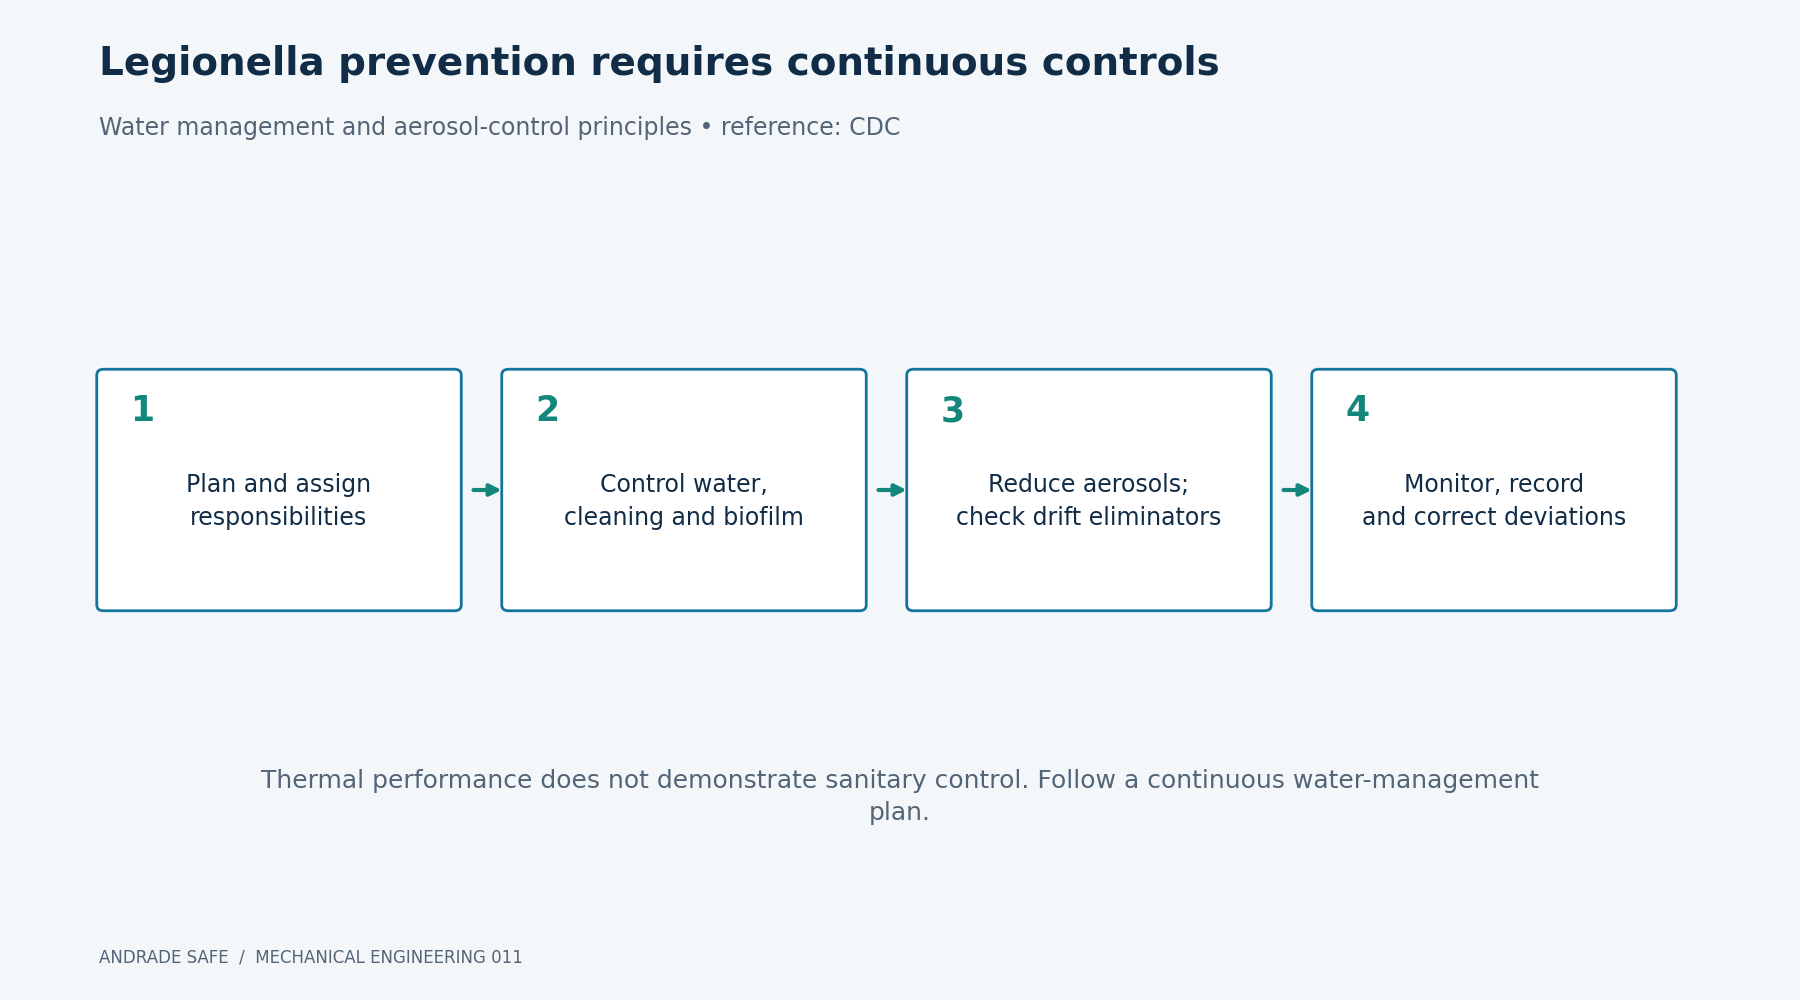
The CDC identifies cooling towers as systems that can support Legionella growth and spread it through aerosols. Control requires continuing water management, including growth-promoting conditions, sediment, biofilm and treatment effectiveness. Warm water alone does not calculate a disease probability, and CoC is not a sufficient sanitary indicator. Mechanical and microbiological performance must be assessed on their own evidence.
A water-management program should identify the system and its control points, establish limits and corrective actions, monitor performance and verify implementation. Cleaning, disinfection, maintained drift eliminators and attention to nearby air intakes form part of prevention. Frequencies and procedures should reflect the installation and applicable technical guidance without improvising chemical doses or substituting this article for a management plan.
A visible white plume can result from water vapor condensing when warm, moist exhaust mixes with ambient air. It does not prove Legionella contamination. Conversely, no visible plume does not establish absence of droplets or sanitary safety. Temperature, drift and cycles of concentration cannot turn the teaching laboratory into a numerical medical-risk index.
Safe operation starts before cleaning
Inspecting or cleaning a tower involves hazards beyond water: moving parts, electricity, height, chemicals and potentially restricted-access spaces. Planning, energy isolation, authorization and access arrangements must suit the task. A tower switched off at the supervisory interface still requires confirmation that fans and other equipment cannot start unexpectedly during the intervention or expose the maintenance team.
Considering location and aerosol pathways helps protect occupants, workers and ventilation systems. CDC guidance calls for attention to air intakes and occupants when planning towers. A distance or procedure found in a foreign reference should not automatically be described as a Brazilian legal obligation; local requirements and actual conditions need verification in design and operation.
After shutdowns and interventions, restart deserves a documented procedure: verify cleanliness, water condition, treatment, circulation and functioning controls before returning to the intended service. Records should identify deviations, responsible people and actions. An isolated certificate or maintenance photograph does not replace evidence that the management program continues functioning effectively over the full operating period.
CDC — Controlling Legionella in Cooling Towers →
CDC — Overview of Water Management Programs →
| Check | Why it matters | Useful evidence |
|---|---|---|
| Water and treatment | Deposits, corrosion and microbiological control | Records, trends and corrective actions |
| Eliminators and distribution | Drift and air–water contact | Inspections and maintenance |
| Water management | Continuity of sanitary controls | Responsibilities, limits and verification |
| Interventions | Energy, access and chemicals | Procedures, isolation and release |
Use the laboratory as a lesson in balances
The interactive laboratory on this page, also available as a standalone download, varies heat duty, temperatures, wet bulb, cycles and drift percentage. Start with units and input validity. If entering water is not warmer than leaving water, or the approach is incompatible with a finite conventional evaporative tower, revise the scenario before interpreting outputs.
Compare two scenarios while holding other variables constant: change CoC to examine blowdown, or change heat duty to follow circulation and model evaporation. Drift percentage applies to circulating flow, not make-up. Qualitative notices help identify assumptions; they do not measure microorganisms, exposure, certified efficiency or the need for any particular chemical treatment.
The CSV records the example inputs and results for checking calculations without running the laboratory. The kit includes teaching material and image credits. There is no connection to field instruments: users supply hypothetical scenarios. Actual equipment selection requires design weather, process requirements, verified capacity, hydraulic assessment and a water-management plan appropriate to the installation.
Laboratory — heat and water in a cooling tower
Change the six inputs and compare the balances. Calculations run locally in your browser; there is no sensor connection.
Educational model. Does not replace design, tower selection or a water treatment plan.
Example inputs
Calculated results
- Range
- 6.0 K
- Approach
- 5.0 K
- Circulating mass flow
- 19.908 kg/s
- Circulating water flow
- 71.667 m³/h
- Evaporation (100% latent assumption)
- 0.750 m³/h
- Calculated blowdown
- 0.149 m³/h
- Water drift
- 0.001 m³/h
- Total makeup
- 0.900 m³/h
| Component | Flow rate (m³/h) |
|---|---|
| Evaporation (100% latent assumption) | 0.750 |
| Calculated blowdown | 0.149 |
| Water drift | 0.001 |
| Total makeup | 0.900 |
Assumptions and limits
Steady state, no leaks; water density ρ = 1,000 kg/m³ and cp = 4.186 kJ/(kg·K). ṁevap = Q / hfg and E = 3.6 × ṁevap, with hfg = 2,400 kJ/kg, assign the entire load to evaporation (ṁevap in kg/s; E in m³/h). Real towers also exchange sensible heat; these results are not a forecast of measured consumption.
B = E / (CoC − 1) − D; M = E + B + D. Drift D carries water at the circulating salt concentration. CoC is a concentration ratio, not a count of physical water trips.
A positive approach is only a necessary condition in this model. The calculation does not check tower capacity, airflow, fill, outlet humidity or auxiliary power. A smaller approach demands more from equipment selection; it does not prove superior efficiency.
Health control: these numbers do not estimate Legionella presence, disease probability or personal protection. A water management program, treatment, cleaning, stagnation and aerosol control, and verification by qualified professionals are needed.
Download standalone laboratory →Thermodynamics, water and public health share one decision
In buildings, towers can reject heat from HVAC systems; in chemical plants, refineries and steelworks, they can serve utilities and process loops. Thermal power stations and other generating plants also use cooling to reject heat from their cycles. Configuration depends on the application. In data centers, the chain can begin at a chip and end at external heat-rejection infrastructure; the related articles help trace these components.
When a cooling tower works well, it can seem invisible. Behind that apparent simplicity lies engineering of heat, water, materials, chemistry and public health. A strong outcome is demonstrable: meet thermal duty, explain consumption, maintain integrity and sustain documented sanitary controls, while keeping a classroom example distinct from any performance guarantee for a real installation.
The air-conditioning paradox →
Frequently asked questions
How does a cooling tower work?
It rejects heat from water to air through heat and mass transfer, mainly by evaporating a fraction of the water. The served system supplies the heat; fans and pumps can require auxiliary electricity.
What is range?
It is the difference between entering hot-water and leaving cold-water temperatures. In the example, 35 − 29 = 6 °C. For specified duty and properties, it also depends on circulating flow.
What is approach?
It is the difference between leaving cold-water temperature and entering-air wet-bulb temperature. Here, 29 − 24 = 5 °C. Reducing it requires greater transfer capability under comparable conditions; it is not a stand-alone measure of whole-system efficiency.
What circulating flow carries 500 kW in the example?
For water with cp = 4.186 kJ/(kg·K), a 6 °C range and density of 1,000 kg/m³, flow is 19.9076 kg/s or 71.6675 m³/h. This is not make-up water flow.
Does rejecting 500 kW always evaporate 0.75 m³/h?
No. That value assigns the entire duty to latent heat using hfg = 2,400 kJ/kg. Actual evaporation depends on psychrometric conditions and the installation’s sensible and latent heat balance.
What are blowdown and make-up?
Blowdown intentionally removes concentrated water. Make-up is the total replacement flow. In the simplified leak-free balance, M = E + B + D, including evaporation, blowdown and drift.
How is blowdown calculated when drift is included?
For the adopted conservative balance, B = E / (CoC − 1) − D. Omitting D requires negligible drift. A negative result indicates incompatible conditions rather than physically negative discharge.
Are higher cycles of concentration always better?
No. They can reduce blowdown and make-up, but water chemistry, materials, scale, corrosion, temperature and treatment impose limits. CoC is neither the number of tower passes nor an indicator of microbiological safety.
Does a closed-circuit tower eliminate Legionella risk?
Not automatically. Process fluid may be isolated, but an evaporative tower’s external spray-water circuit still contacts air and can generate aerosols. Water management, cleaning and control measures remain necessary.
Does a white plume or the laboratory indicate disease risk?
No. A plume may be condensed water vapor and does not establish contamination; its absence also does not prove safety. The laboratory teaches balances without measuring microorganisms, exposure or disease probability.
References
- CDC — Controlling Legionella in Cooling TowersCDC
- CDC — Overview of Water Management ProgramsCDC
- DOE FEMP — Best Management Practice #10: Cooling Tower ManagementDOE FEMP
- EPA WaterSense at Work — Section6.3 Cooling TowersEPA WaterSense at Work
- DOE — Cooling Towers: Understanding Key Components and How to Improve Water EfficiencyDOE
- SPX Cooling Technologies — Cooling Tower Performance: Approach(TR-016)SPX Cooling Technologies
- SPX Cooling Technologies — Basic Theory and Practice(CTII-01A)SPX Cooling Technologies
- Baltimore Aircoil — What is a Cooling Tower?Baltimore Aircoil
- Baltimore Aircoil — What is a Closed Circuit Cooling Tower?Baltimore Aircoil
- NISTIR5078 — Thermodynamic Properties of Water, IAPWS-95 TablesNISTIR5078
- DOE / Lawrence Berkeley National Laboratory — Variable-Speed FanDOE / LBNL
- Rooftop induced-draft cooling tower for HVAC — AloofmanishWikimedia Commons / Aloofmanish
- CC BY-SA 4.0Creative Commons
- Open-loop cooling-tower cell with visible fill and circulating water — SAF (SAF1999)Wikimedia Commons / SAF (SAF1999)
- Fan detail of a Marley Aquatower cooling tower — Steve JohnsonWikimedia Commons / Steve Johnson
- CC BY 2.0Creative Commons