
Explore steel quenching, tempering, austenite and martensite through TTT/CCT diagrams, Jominy testing, cooling examples and applications.
From chemistry to performance in service
Two parts made from the same steel can behave differently because heating and cooling change their microstructure. Quenching may form martensite and increase hardness; tempering adjusts the hardened condition for service. Hardness is a local indentation response, whereas hardenability describes the ability to harden in depth under specified conditions.
Consider two shafts produced from the same heat of steel. Both enter a furnace, but their subsequent thermal paths are different. One cools quickly and the other more slowly. Even though the chemistry may be identical, the final microstructures, hardness and response to service loads may differ substantially. Heat-treatment history is an engineering variable, not merely a manufacturing detail.
Microstructure connects processing to performance
In the iron-carbon system, ferrite has a body-centered cubic structure while austenite has a face-centered cubic structure. Cementite is an iron carbide (Fe₃C). Pearlite is a lamellar mixture of ferrite and cementite rather than a single phase. Bainite includes several microstructural morphologies that form under appropriate conditions. Martensite develops through a largely diffusionless transformation accompanied by lattice distortion.
The eutectoid temperature around 727 °C is a useful equilibrium reference, not a universal austenitizing recipe. Commercial steels differ in carbon and alloy content, critical temperatures, section dimensions and time-temperature response.
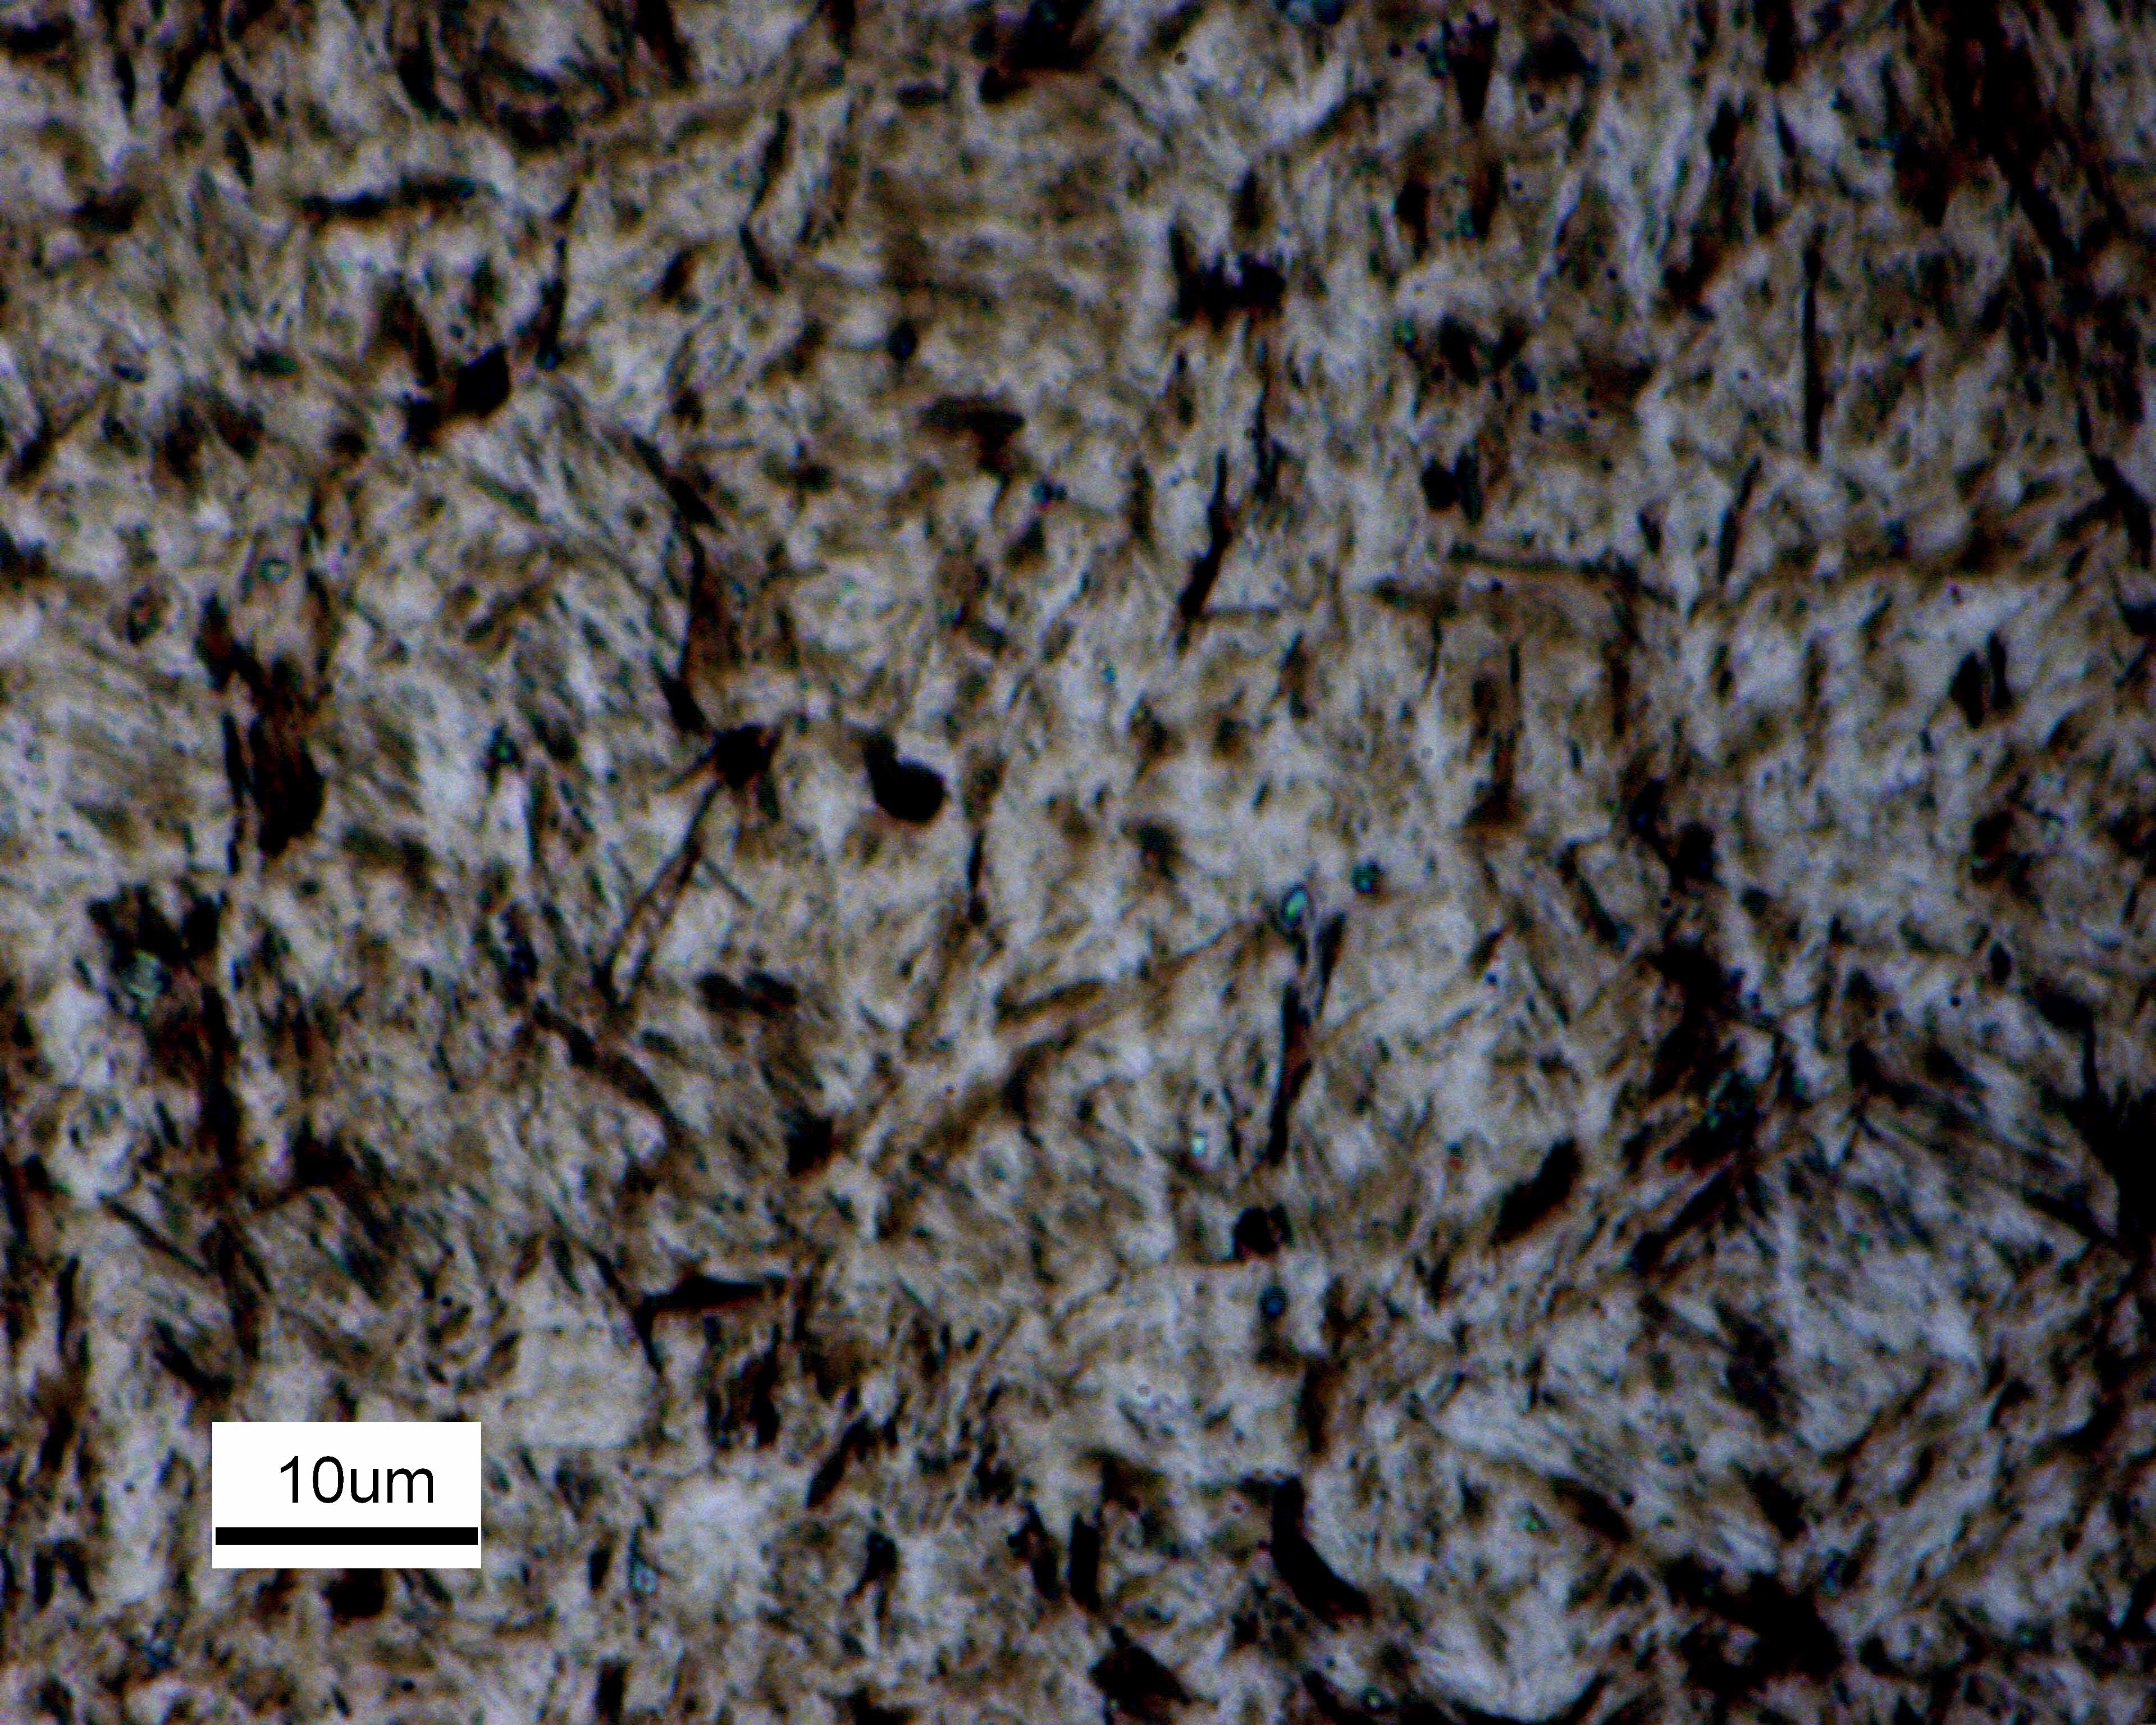
Morphology, constituent distribution and grain size matter as well as phase names. Martensite does not imply one fixed property: carbon content, transformed fraction, retained austenite and subsequent treatment change the response. A micrograph needs preparation, etching and scale information; appearance alone cannot establish chemistry or a hardness profile.
Austenitizing, quenching and tempering
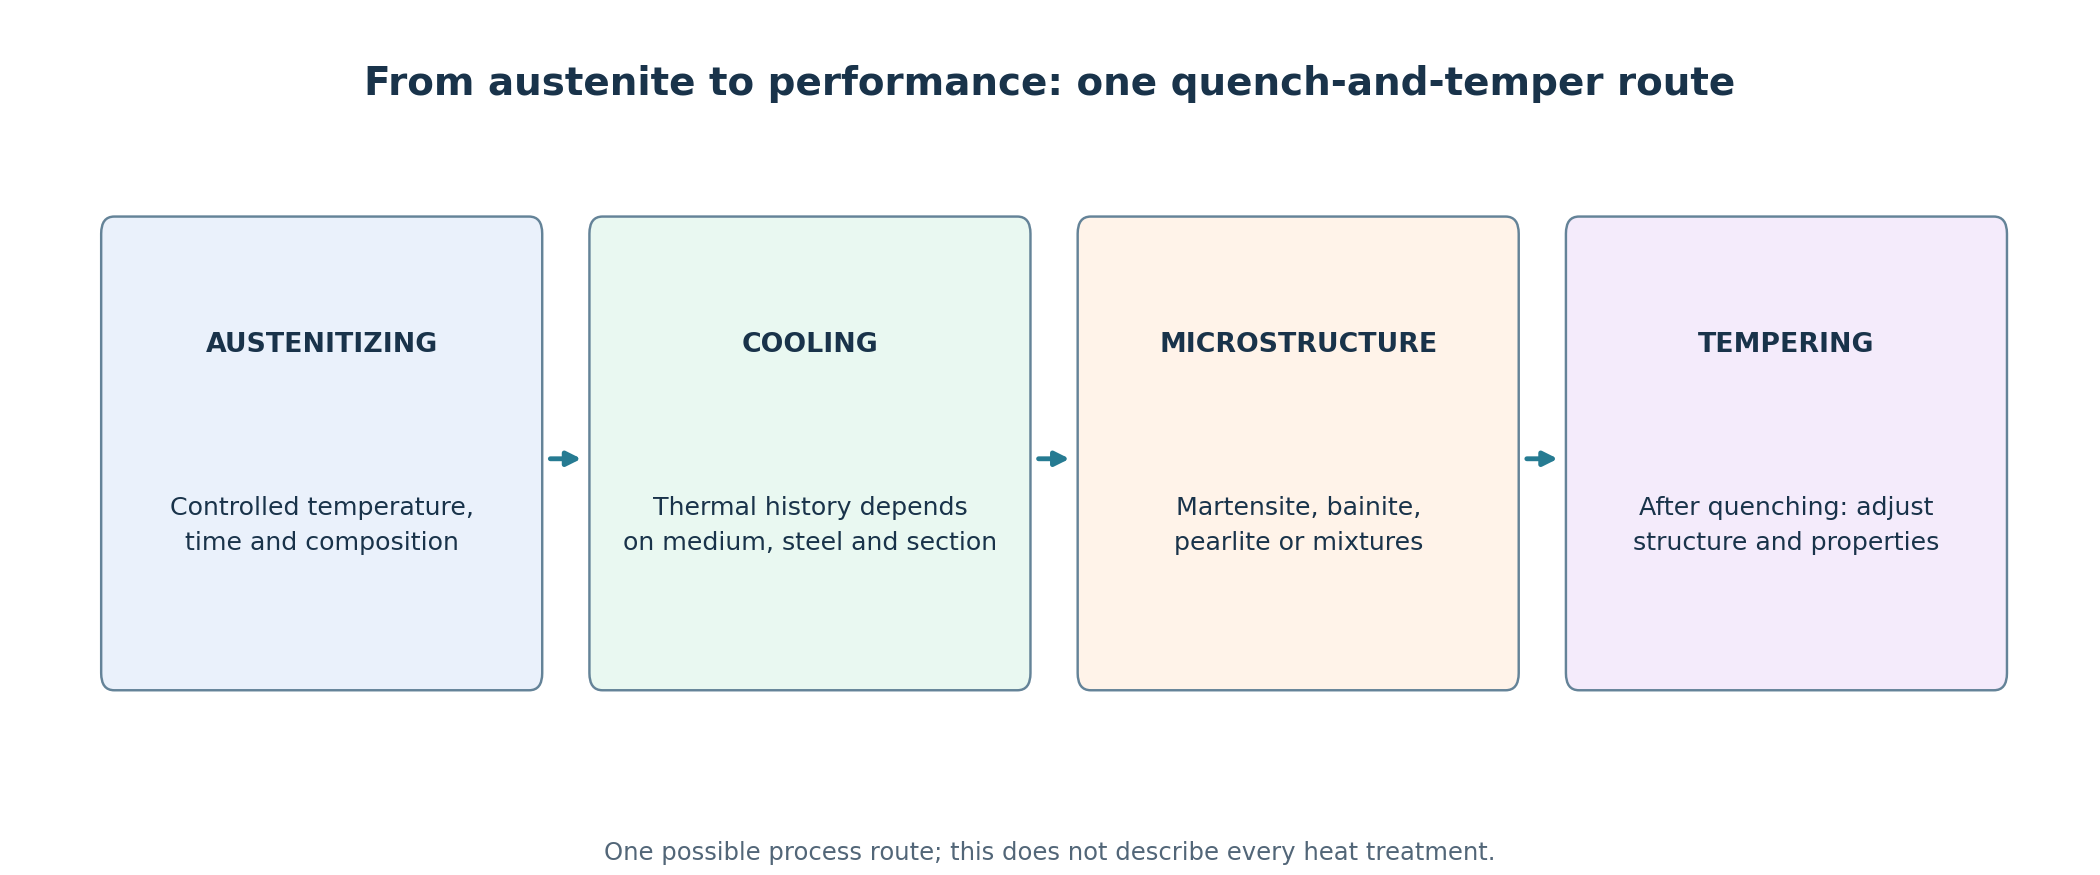
Austenitizing establishes an austenitic starting condition through controlled heating and soaking. Actual process selection must consider chemistry, carbide dissolution, grain growth and part geometry. Quenching cools the part under conditions chosen to develop the desired hardening response. The transformation to martensite can increase hardness substantially, but severe cooling can also cause distortion, residual stresses and quench cracks.
Tempering is a subsequent, usually subcritical heat treatment used to modify the hardened microstructure and its properties. It may relieve residual stress, promote carbide precipitation and improve the balance between strength, toughness and ductility. The response is not universal: alloying, retained austenite, secondary hardening and temper embrittlement can complicate a simple “higher temperature equals softer steel” narrative.
Other routes: select the process for the function
Annealing and normalizing can change the starting condition, assist processing or adjust microstructure; neither is one universal cycle for all steels. Austempering uses a selected isothermal stage to develop a bainitic structure. Martempering seeks to reduce temperature differences before martensitic transformation, with appropriate subsequent treatment. The routes have different objectives and requirements.
Surface hardening by localized energy and thermochemical treatments are also different. Induction can transform a layer without deliberately adding carbon; carburizing changes surface carbon content and is combined with later stages; nitriding introduces nitrogen through its own mechanisms. Case depth, transition to the core and material compatibility must be specified and verified.
TTT versus CCT diagrams
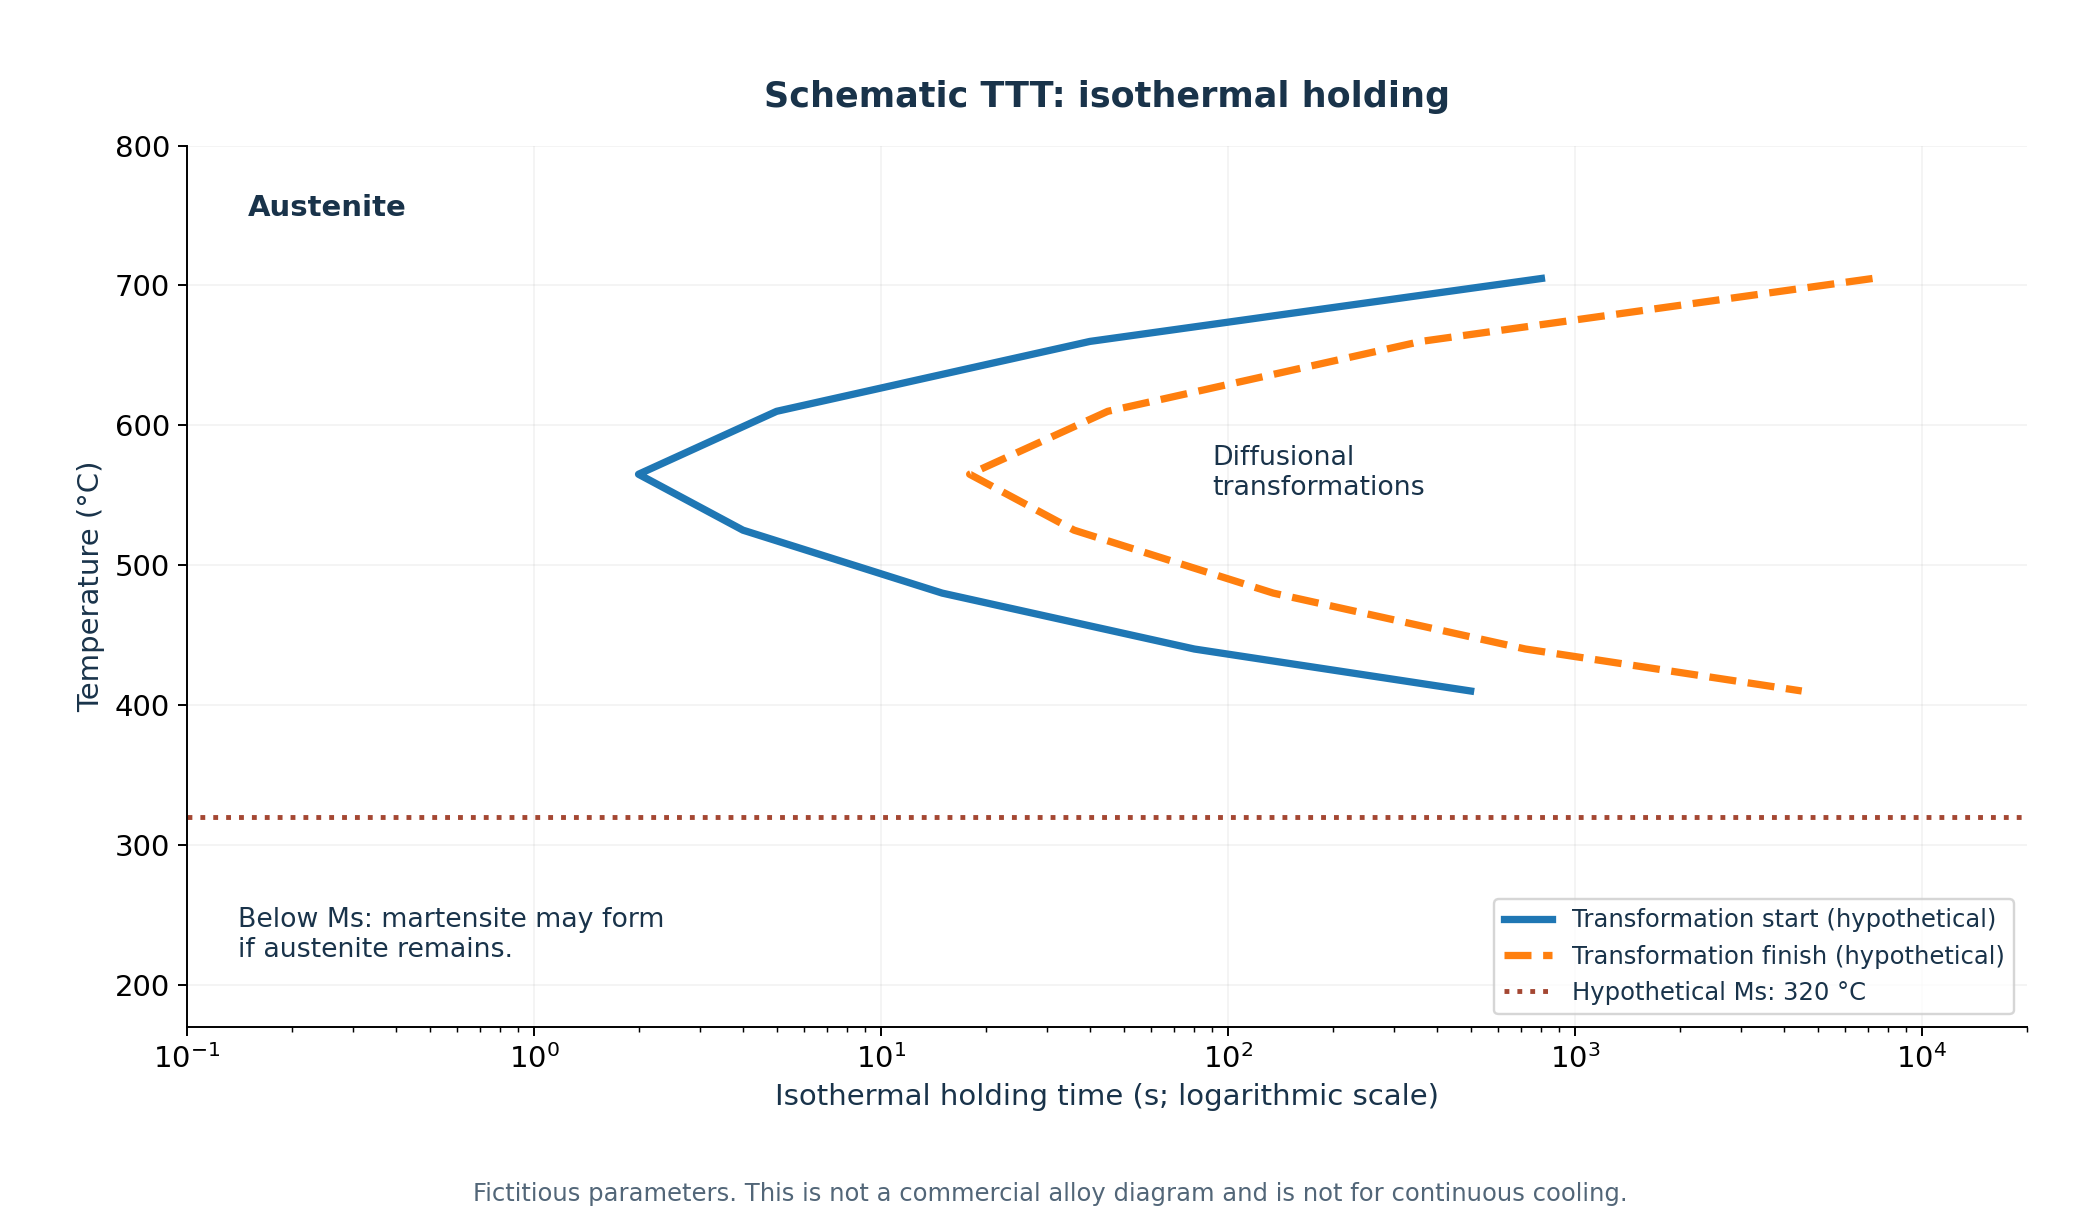
A TTT (time-temperature-transformation) diagram describes transformation during isothermal holding at selected temperatures. Its time axis is often logarithmic, and the nose of a transformation curve represents relatively rapid transformation kinetics.
A CCT (continuous cooling transformation) diagram tracks transformation during continuous cooling. It is more directly applicable to many industrial quenching paths, but it is specific to the steel and the tested conditions. A generic TTT diagram is not a certified CCT diagram for a particular grade.
The martensite-start temperature Ms and martensite-finish range Mf are material-dependent. Furthermore, the surface and core of a thick component can cool at very different rates.
To read actual transformation data, begin with steel identity, austenitizing condition, grain size and test conditions. Then check scales, start/finish boundaries and the thermal path at the relevant position in the part. On a logarithmic axis equal intervals represent time factors rather than equal increments of seconds. Ms indicates transformation start only where austenite remains under relevant conditions; crossing an illustrative line does not supply a transformed fraction.
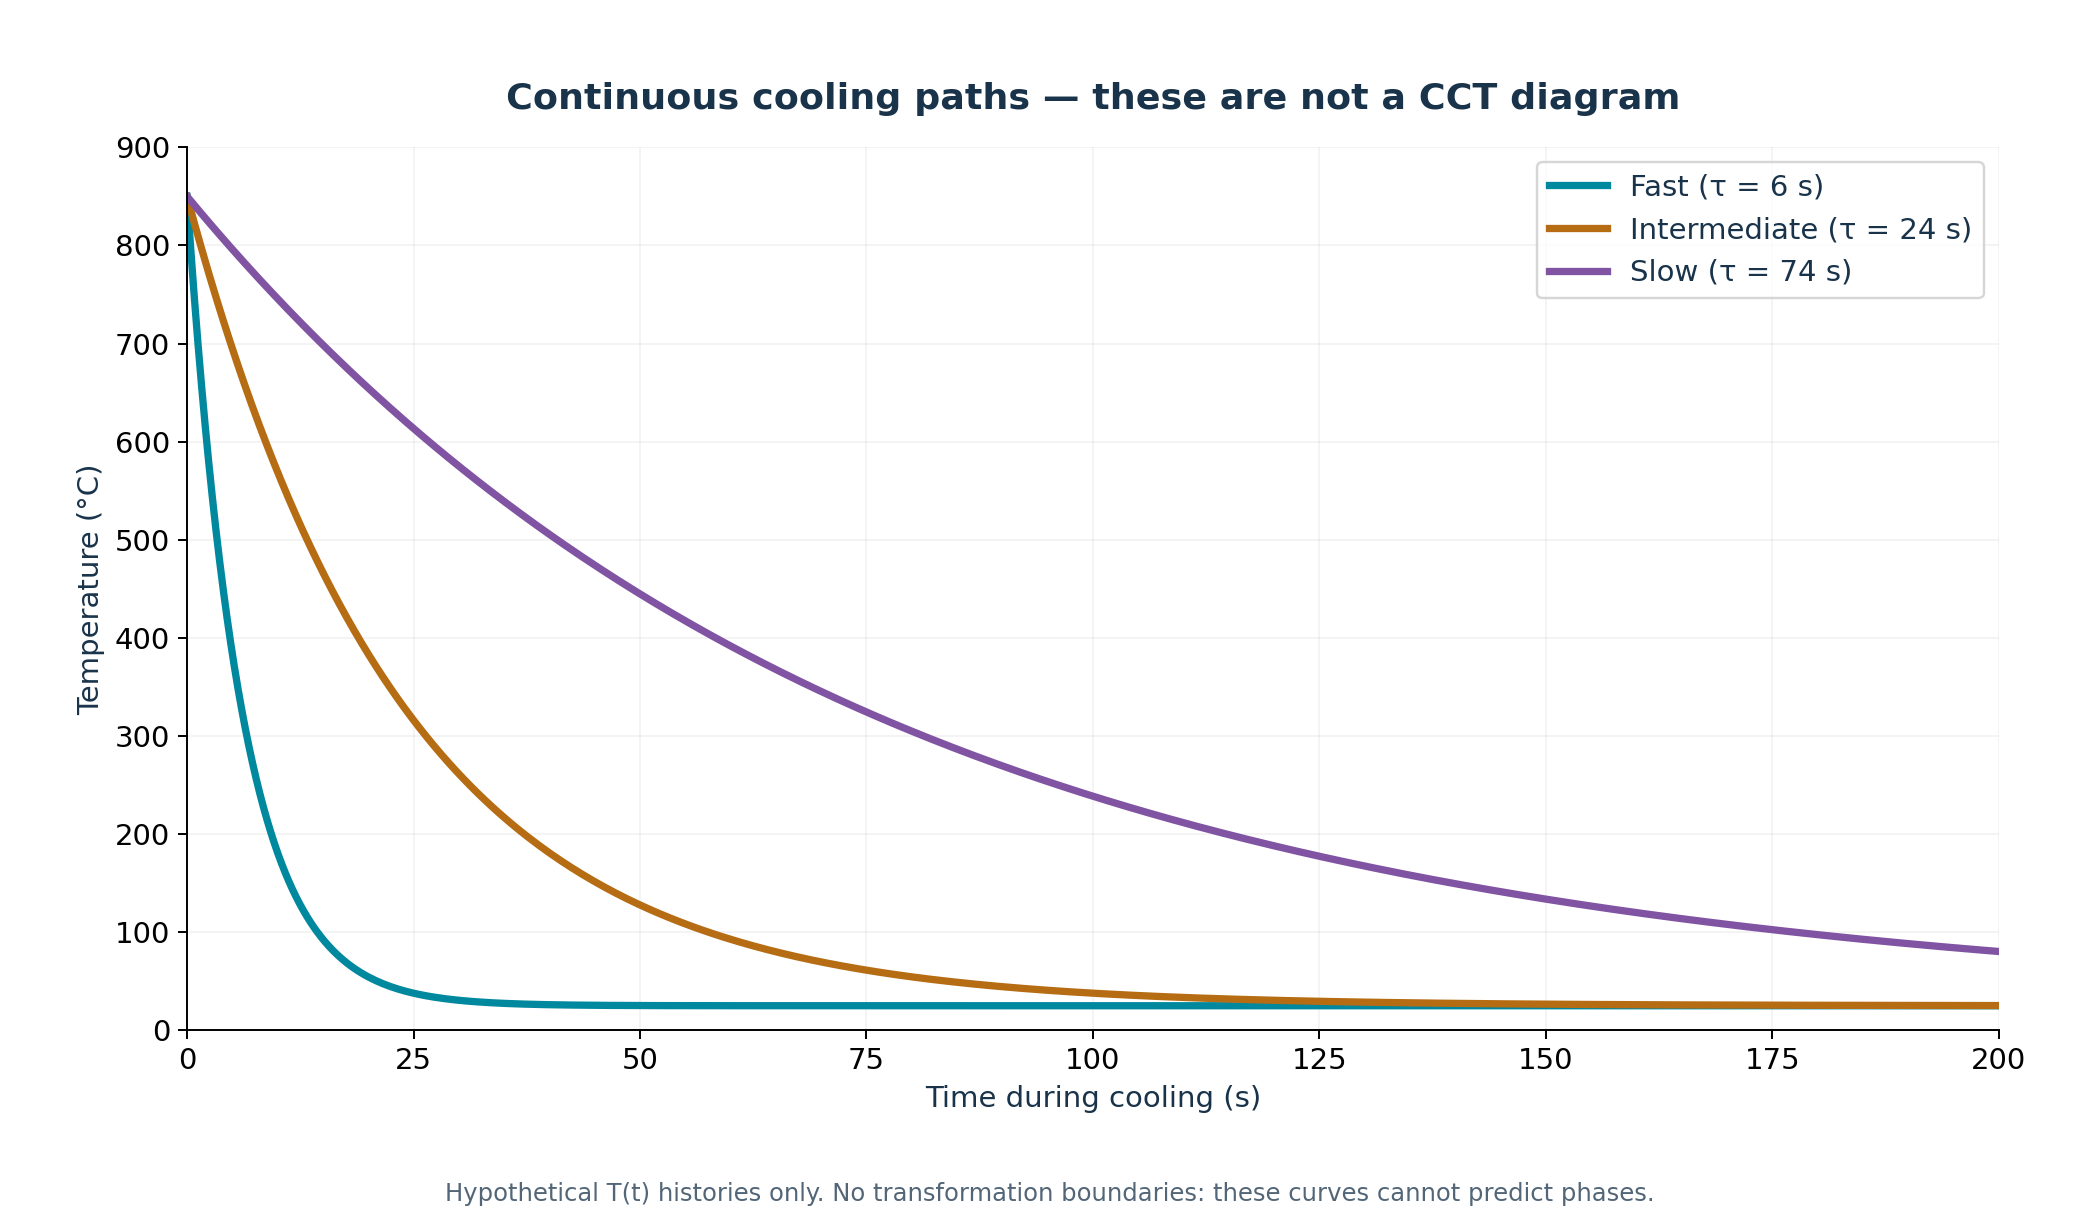
The TTT figure here is a schematic of isothermal kinetics; the continuous-cooling figure contains hypothetical thermal paths only. Those paths are not a commercial-steel CCT diagram: measured transformation boundaries for a specified composition and test condition are missing. The laboratory exponential curve likewise cannot convert time directly into pearlite, bainite or martensite fractions.
Why quench cracks and distortion occur
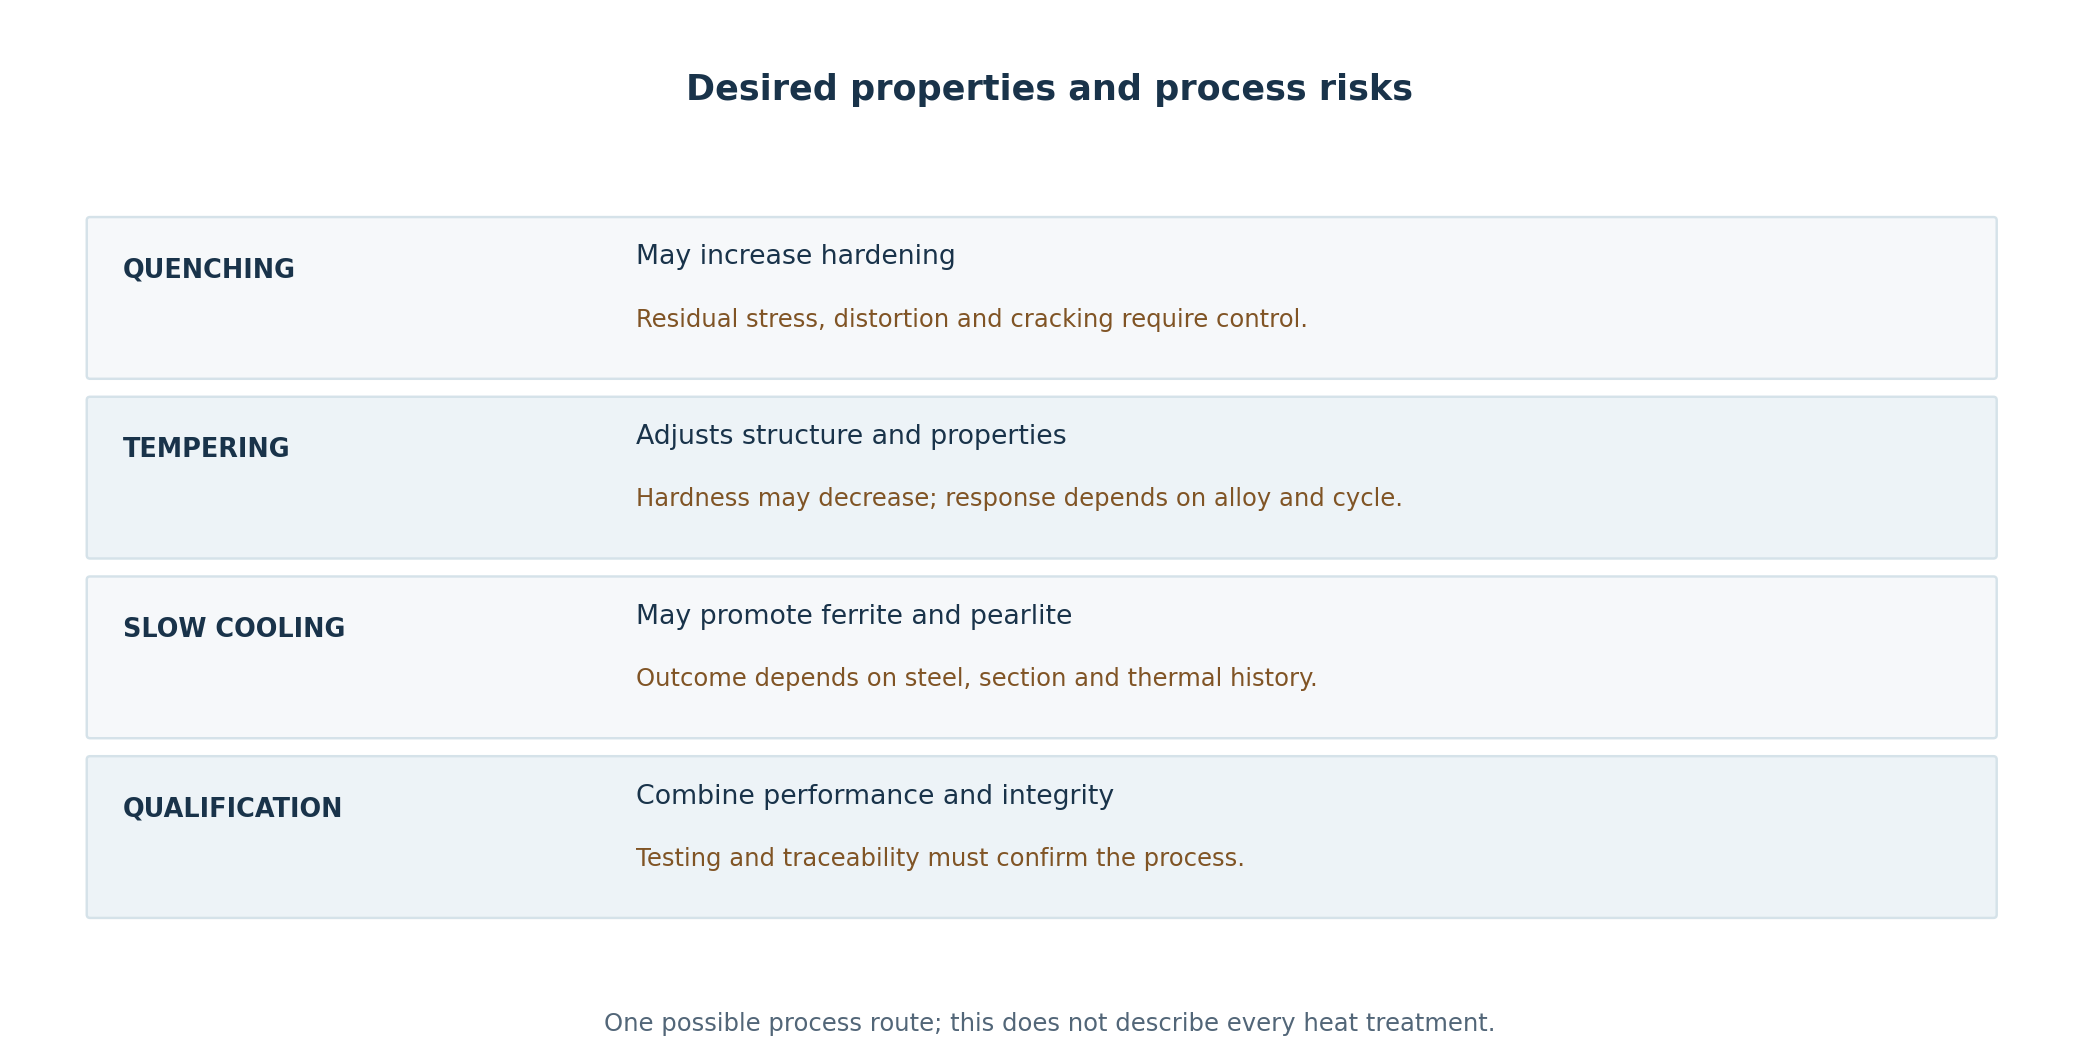
Thermal gradients and transformation strains may create complex residual stresses. Thick sections, sharp corners, abrupt geometry changes and pre-existing defects can aggravate cracking or distortion. A high hardness value cannot substitute for toughness, fatigue resistance or dimensional stability.
Engineers should choose treatment processes based on service loads and failure modes. Gears may need surface durability and contact-fatigue resistance, shafts may face repeated torsion and bending, and tools may need a different hardness-toughness balance. Surface and case-hardening methods may be appropriate in some applications, but must be specified using verified material and process data.
A quench medium does not have one fixed severity independent of operation. Fluid condition, agitation, temperature, surface state and geometry affect heat transfer. In liquids, transfer mechanisms may change during cooling. Therefore the exercise time constant is not an oil, water or polymer datasheet and cannot authorize selection of an industrial quench bath.
Tempering: adjust properties and verify the outcome
Tempering evolves the hardened microstructure during a subsequent cycle. Carbon redistribution, carbide precipitation and structural recovery can change hardness, stability and mechanical response. A common purpose is to reduce brittleness of the freshly hardened condition, but toughness does not universally improve with every increase in temperature.
Composition and cycle may promote secondary hardening or embrittlement ranges. Retained austenite and later transformations also matter. Actual material data and inspection requirements therefore take priority over a simple hotter-means-softer rule. Tempering records need their own traceability, linked to the batch and final measurements.
Hardness and hardenability are not interchangeable
Hardness is a local property measured by an indentation test, such as Rockwell. Hardenability describes how deeply a steel can harden under specified quenching conditions.
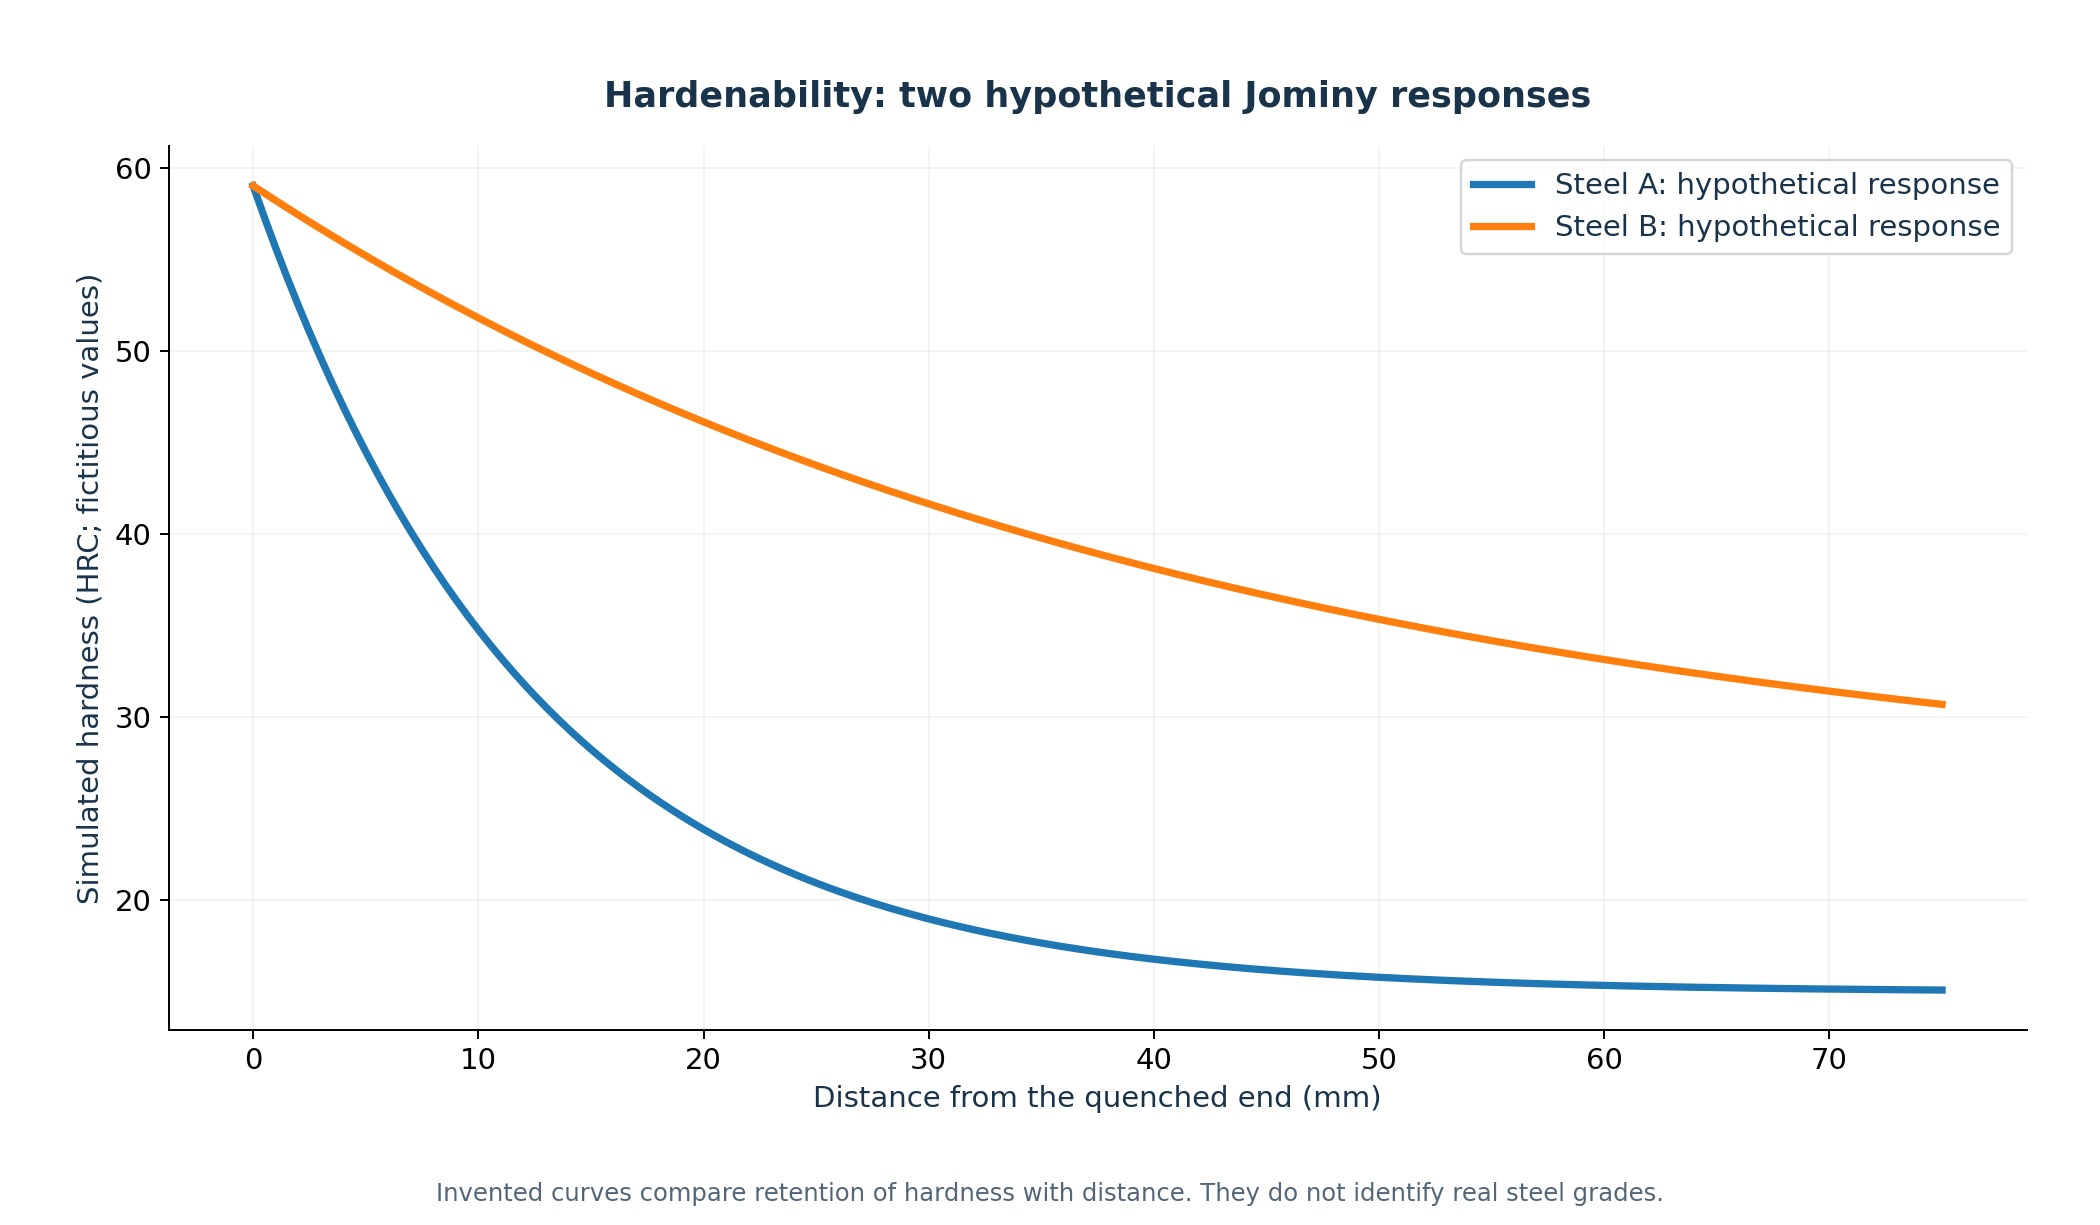
The Jominy end-quench test, covered by ASTM A255-26, cools one end of a standardized cylindrical specimen and measures hardness along its length. The resulting response helps compare the depth of hardening of different steels. Two grades may achieve similar high hardness near the quenched end and behave very differently farther away.
ASTM E18-25 addresses Rockwell testing. A single surface hardness value does not establish the condition of an entire component, its fracture toughness or freedom from cracks.
Both plotted curves are entirely fictional. A and B do not represent AISI 1045, 4140 or any commercial grade, and their values are not acceptance criteria. They illustrate how similar near-end hardness can coexist with different reductions along the specimen. A Jominy response is not automatically the hardness profile of a part: geometry and quench conditions must be related to the actual application.
For hardness testing, record method, scale, location, surface preparation and applicable test requirements. A hardened case, thin section or unfavorable geometry calls for assessment of method suitability. Converting one HRC reading into a conclusion about toughness, phases or assembly safety exceeds the evidence supplied by that test.
Worked cooling exercise: what the curve can calculate
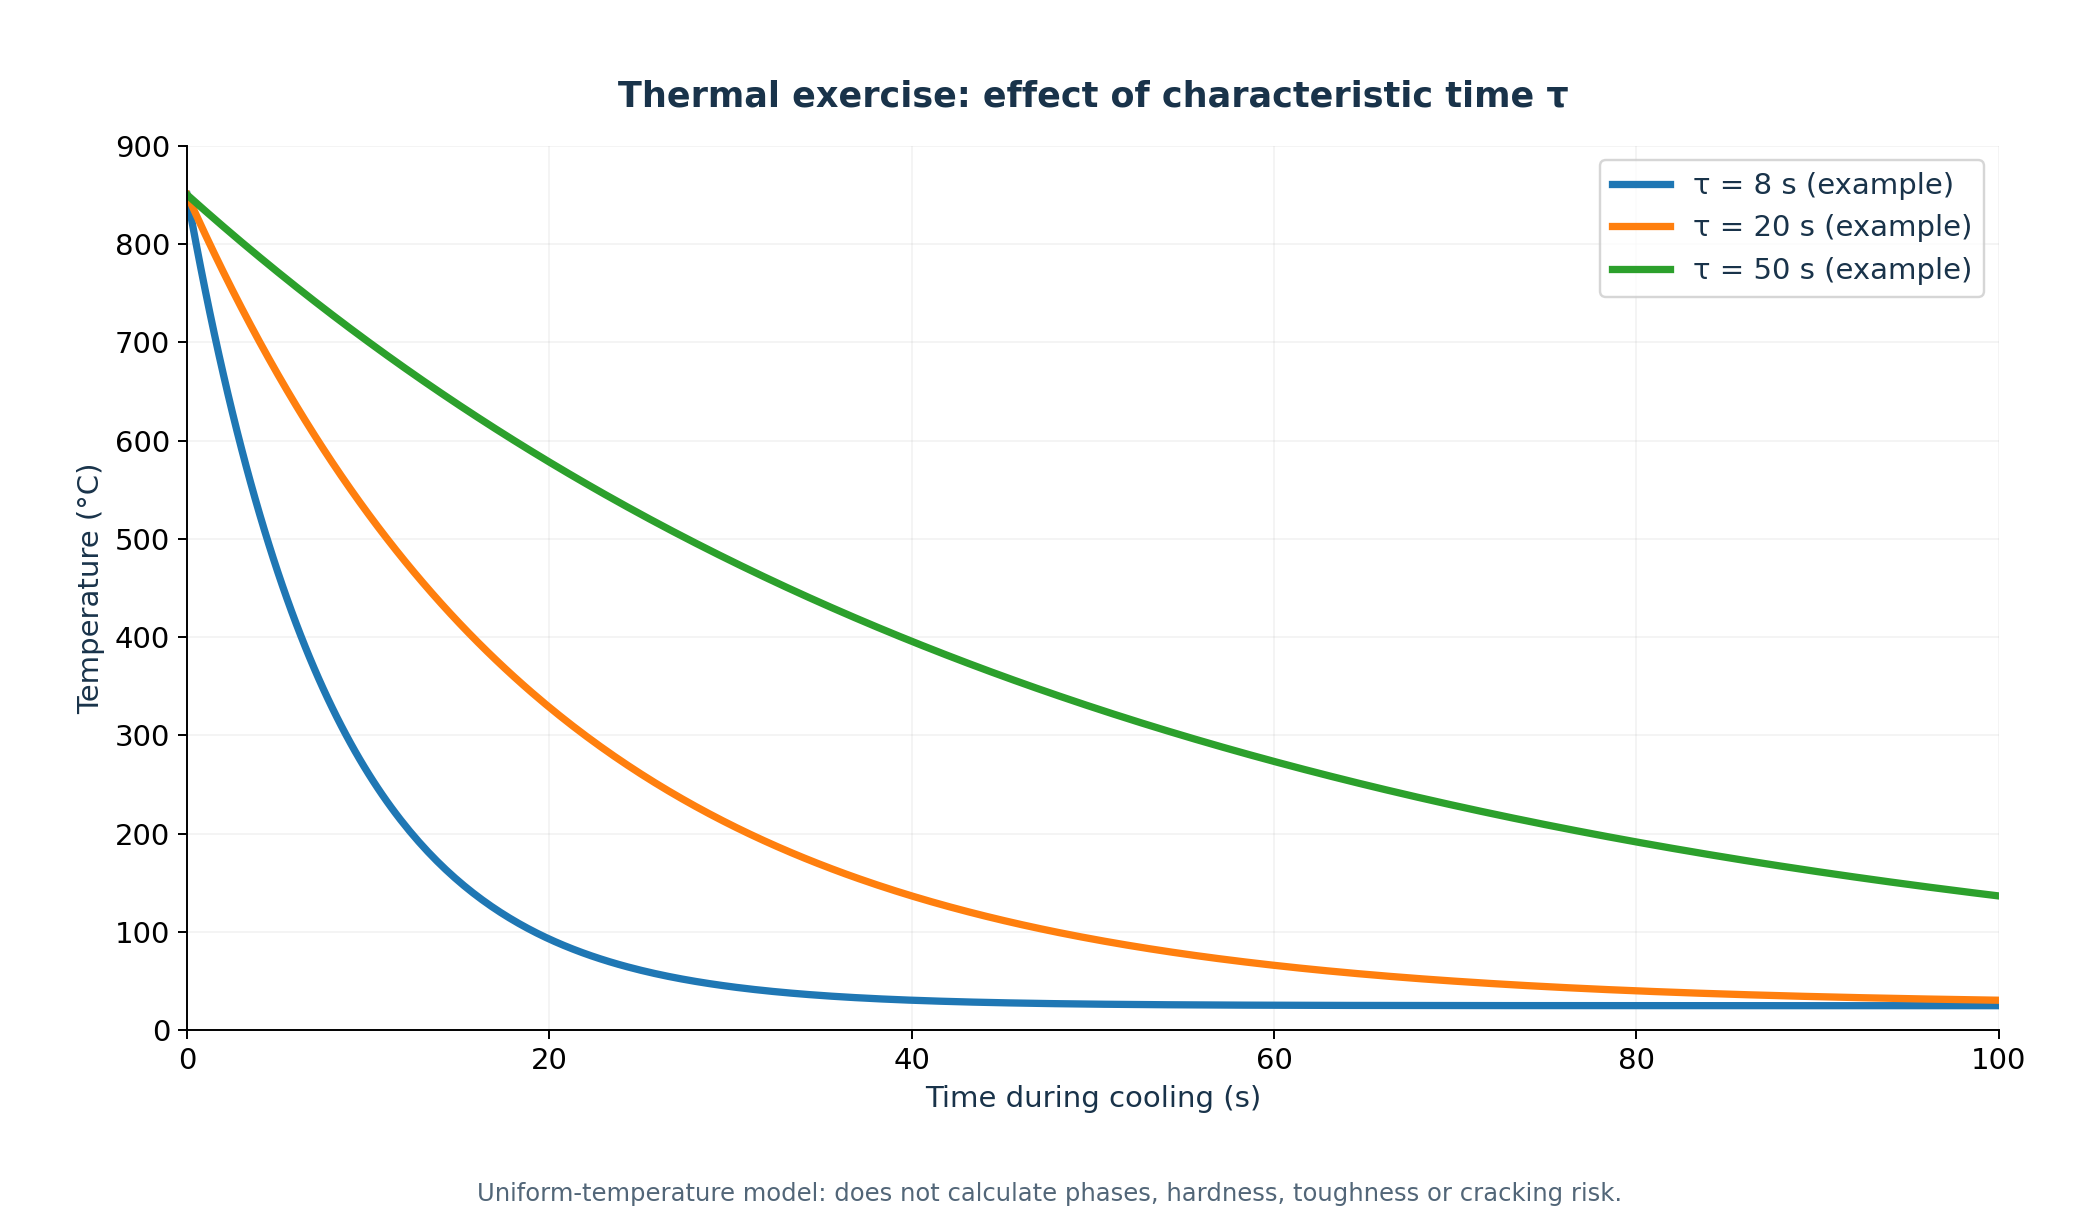
Use T(t) = Tamb + (T0 − Tamb)·exp(−t/τ), with T0 = 850 °C, Tamb = 25 °C and τ = 20 s. T is temperature in °C, t is time in seconds and τ is a hypothetical time constant. Temperature differences can consistently use °C or K.
At 40 s, T(40) = 25 + 825·exp(−2) = 136.6516087 °C, approximately 136.65 °C. For a target between Tamb and T0, t_target = τ·ln[(T0 − Tamb)/(T_target − Tamb)]. Thus t_500 = 20·ln(825/475) = 11.0413716 s, approximately 11.04 s.
The instantaneous rate is dT/dt = −(T0 − Tamb)·exp(−t/τ)/τ; at 40 s it is approximately −5.58 °C/s. The negative sign indicates falling temperature. With τ = 40 s and other inputs unchanged, the time to 500 °C doubles to 22.08 s. These results do not determine phase fractions, hardness or crack risk.
The model assumes spatially uniform temperature and a constant time scale. It does not separately resolve core and surface, changing properties, transformation latent heat or actual boiling stages. Engineering use of a lumped-capacitance approximation requires assessing internal gradients and heat transfer. Ambient temperature is an asymptotic limit, never reached in finite time in this model.
| τ (s) | T(40 s) (°C) | t500 (s) | dT/dt (40 s) (°C/s) |
|---|---|---|---|
| 20 | 136.65 | 11.04 | −5.58 |
| 40 | 328.50 | 22.08 | −7.59 |
| 80 | 525.39 | 44.17 | −6.25 |
Laboratory: explore educational cooling
Change temperatures, time and τ to explore the equation. Ms and tempering temperature are illustrative references; they do not identify a grade or change the cooling equation to calculate transformations. The tool includes a graph, table, reset and CSV export. Its output is not a heat-treatment specification.
Laboratory: simplified thermal path
Explore how a hypothetical time constant changes cooling in a body with a spatially uniform temperature.
Educational model: this is not a TTT or CCT diagram. It cannot predict actual part cooling, phase fractions, hardness, stresses, distortion or cracking risk; it is not a production recipe.
Educational parameters
The tempering temperature is an annotation only. It does not alter this path or establish material properties.
Cooling path — illustrative model
━ Selected scenario┄ Reference: τ = 25 s⋯ Hypothetical Ms
Ms is a hypothetical reader-selected reference with no steel grade attached. Crossing it does not calculate the actual onset or fraction of martensite.
The target must be above Tamb and no higher than T0. At T0 the time is zero; Tamb is an asymptotic limit with no finite arrival time.
T(t) = Tamb + (T0 − Tamb) exp(−t/τ)
dT/dt = −(T0 − Tamb) exp(−t/τ) / τ
Lumped capacitance: spatially uniform temperature, constant properties and constant ambient temperature. It ignores latent heat, transformations, composition, kinetics and surface-to-core gradients. τ is hypothetical and does not identify a quenching medium.
| Time (s) | Temperature (°C) | dT/dt (°C/s) |
|---|---|---|
| 0 | 850.00 | -41.25 |
| 10 | 525.39 | -25.02 |
| 20 | 328.50 | -15.18 |
| 40 | 136.65 | -5.58 |
| 60 | 66.07 | -2.05 |
| 100 | 30.56 | -0.28 |
| 200 | 25.04 | -0.00 |
Quality, reliability and occupational safety
An effective process record documents steel identification, chemistry, furnace and workpiece temperatures, soaking time, quench medium and conditions, tempering cycle, measured hardness locations and any dimensional or metallographic checks. Hot workpieces, certain quench media, fumes, moving loads and fire hazards require appropriate safety controls.
Heat treatment also connects directly to fatigue, tribology, vibration and failure investigation. Microstructure and residual stress influence how components wear, crack and resist repeated loading.
| Component | Loading / objective | What to relate |
|---|---|---|
| Gears | Wear and contact fatigue | Surface condition and core transition |
| Shafts | Repeated bending and torsion | Fatigue, toughness and geometry |
| Tools | Wear and stability in service | Hardness–toughness balance |
| Bearings | Cyclic contact and precision | Microstructure, cleanliness and dimensional stability |
| Fasteners | Loading and manufacturing route | Required class, hardness and integrity |
| Structural parts | Loading and environment | Strength, ductility and manufacturing requirements |
Quality control and process safety
Ask what evidence confirms the specified property at the critical location before choosing a test. A control matrix can link requirement, batch, measurement position and record. Hardness at defined locations, microstructure, dimensions and crack testing answer different questions; none replaces the others where they are required by the quality plan.
Traceability should connect steel and part identity to furnace cycle, cooling and tempering. Record deviations and assess their effect before product release. Occupational controls must consider hot parts, splashes, atmospheres, fumes, fire in combustible media, handling loads, ventilation, maintenance and protection appropriate to the installation. This article does not provide bath-operating instructions.
Connect microstructure, wear and failure investigation
Metal fatigue helps explain crack initiation and repeated loads; tribology and bearings connect surfaces, lubrication and wear. Vibration and resonance provide context for machine loading. These subjects complement one another without making hardness a sole reliability indicator. Review material, function, cycle and evidence before attributing a failure only to heat treatment.
Conclusion
The goal is not simply to maximize hardness or cool as fast as possible. The goal is to achieve and verify the properties needed by the component in service. In steel, chemistry sets the possibilities; the thermal route shapes the microstructure; the application defines the required compromise.
Laboratory and study materials
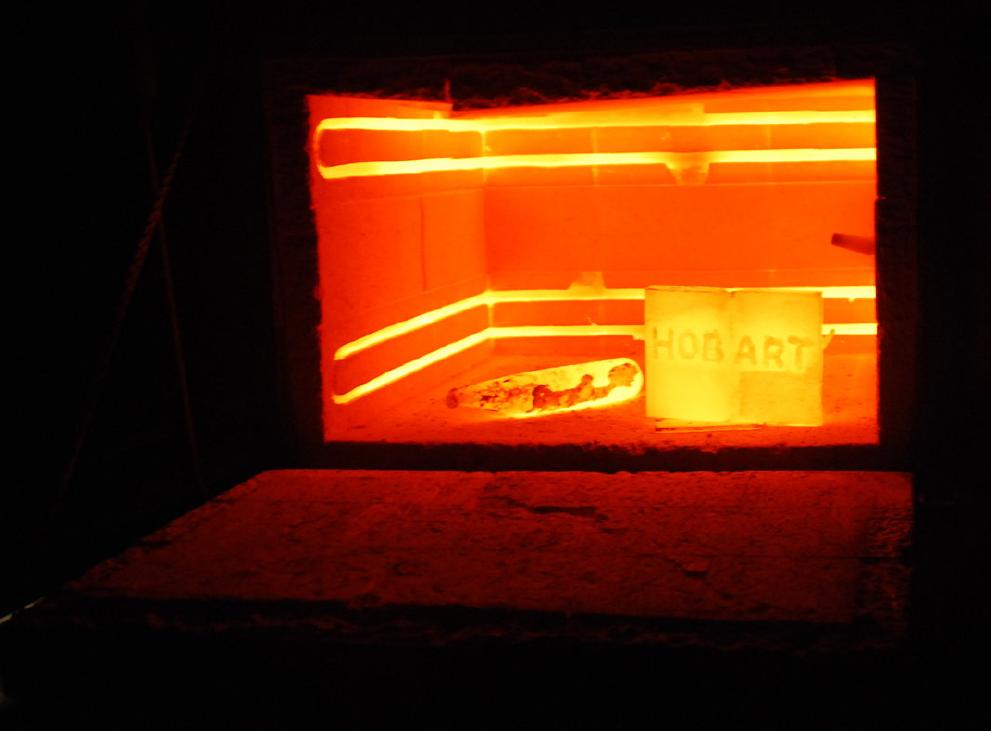
Editorial review: October 18, 2026. Documentary photographs have their own context and do not depict the exercise or Andrade Safe facilities. Diagrams are educational, not certified curves. Original supplied files are preserved in the kit alongside revised materials.
Open standalone laboratory — PT/EN/ES →
Download cooling scenarios CSV →


Primary sources and references
A255-26 and E18-25 were checked in the public ASTM catalogue on October 18, 2026. The ASM references date from 2013 and 2020, rather than a 2026 normative edition.
ASM Handbook 4A — Steel Heat Treating Fundamentals and Processes (2013) →
Hardening and Tempering of Steel — Practical Heat Treating (2020) →
Tempering of Steels — ASM Handbook 4A (2013) →
Schematic TTT diagram for steel →
Frequently asked questions
What does quenching change?
It changes microstructure and may form martensite depending on the steel and thermal path. Section size and starting conditions also affect the outcome.
Are quenching and tempering the same treatment?
No. Quenching cools the part to develop a hardened condition; tempering is a subsequent cycle that adjusts its properties.
How do hardness and hardenability differ?
Hardness is a local indentation response. Hardenability describes the ability to harden in depth under specified conditions.
When should TTT or CCT be used?
TTT describes isothermal transformations; CCT describes transformations during continuous cooling. Use data compatible with the actual alloy and conditions.
Why can a part crack during quenching?
Thermal gradients and transformation strains can generate stresses, aggravated by geometry or defects. The actual cause requires part and process investigation.
Can martensite occur only near the surface?
Yes, through-section differences can result from heating, cooling, composition and surface treatments. Appropriate inspection is needed to confirm them.
What does the Jominy test measure?
Hardness response versus distance from the quenched end of a standardized specimen, used to characterize hardenability.
Does the laboratory predict hardness or martensite percentage?
No. It calculates a hypothetical thermal curve, crossing times and instantaneous rate, without predicting properties or failure risk.
References
- ASM Handbook 4A — Steel Heat Treating Fundamentals and Processes (2013)ASM International
- Hardening and Tempering of Steel — Practical Heat Treating (2020)ASM International
- Tempering of Steels — ASM Handbook 4A (2013)ASM International
- Schematic TTT diagram for steelUniversity of Cambridge / H. K. D. H. Bhadeshia
- ASTM A255-26 — Hardenability of SteelASTM International
- ASTM E18-25 — Rockwell HardnessASTM International